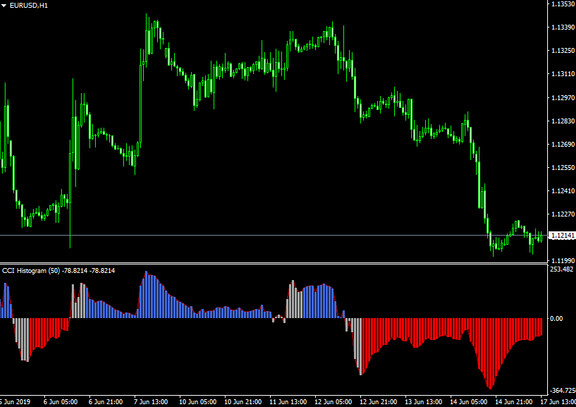
CCI is a very popular indicator. Here is the histogram of such an indicator. Visibility is higher than normal CCI. Also, we have devised a histogram depiction method. Here we will explain such an indicator for MT4.
An example of displaying this indicator together with the normal CCI
Although CCI is an indicator that is easy to use, it looks dull in appearance. If the CCI is histogrammed like this indicator is, the visual appearance will improve materially.
In particular, this indicator also changes color when the CCI reverses. Hence, Forex traders should be easily able to use this CCI histogram for trading. It is quite convenient because you can change the color.
Usage tips:
It is recommended to use it like normal CCI because it is simply histogrammed. For example, if the CCI number exceeds 100, you may want to place a buy order. On the other hand, if it falls below -100, it is a chance to put on the sale order. And conversely, you can terminate positions when the opposite signal appears.
Also, if the color of the histogram changes, it can be an early sign to exit an existing position or to consider entering a new position. For example, if the indicator changes the color to grey (white) after placing a buy order, then it may be time to exit that position because the CCI Histogram indicates the trend might have changed.
However, there are some difficult aspects to trading with the CCI alone. Therefore, the winning percentage will be higher when this indicator is combined with other indicators.
Compatibility: MT4
Parameters:
- Periods - Used for CCI calculation.
- num_bars - Number of CCI bars shown on the sub-window.
Download "CCI_Histogram" from the button below
Tip: Can’t open the downloaded archive file (ZIP or RAR)?
Try WinRAR for Windows or The Unarchiver for Mac .
Do you need help with installing this indicator into MT4 for Windows or Mac OS? Our guide HERE will help you.


