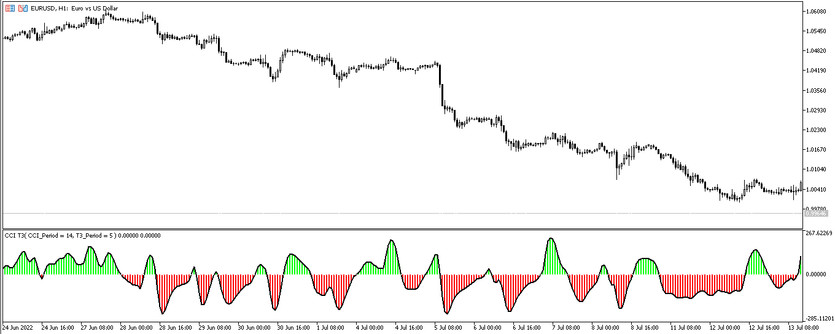
The CCI T3 is a modified version of the CCI trend strength indicator, which is included in the standard forex set. The CCI T3 indicator is more effective and accurate in its signals, and at the same time very convenient in perception. Unlike the standard version, which was displayed on the chart in the form solid line, CCI T3 is represented as a histogram with a signal line that, under certain conditions, crosses its zero level down or up, while being painted in color with a rise or fall value. And taking into account the values of this histogram, it can be easily determined the current trend and identify the best time to open positions.
The CCI T3 indicator is suitable for use on any timeframe, with any currency pairs, since their values do not affect the effectiveness of the indicator in any way.
Input parameters
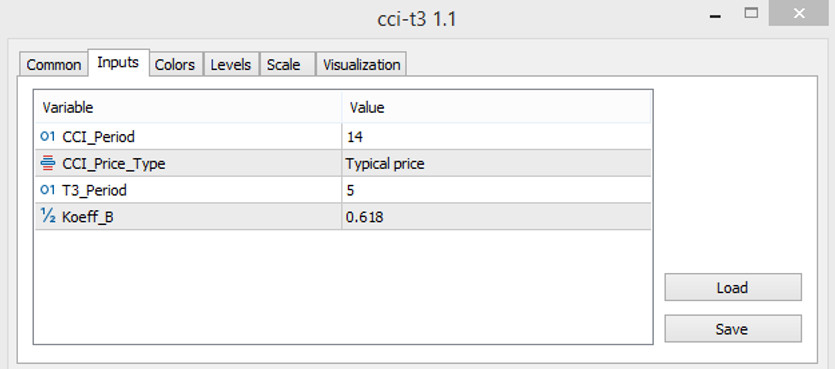
In the settings of the CCI T3 indicator, there are four input parameters, which in turn are divided into two, that is, those related to the CCI indicator and those related to T3, which perform general indicator calculations. The indicator parameters also have a Colors section, thanks to which can completely change the color scheme and thickness of the indicator values, and in the Levels section, in addition to the already added level 0, additional signal levels can be added.
- CCI Period - parameter of the period of the CCI indicator. The default value is 14.
- CCI Price Type - parameter responsible for the type of price to which the indicator calculations will be applied. Default value is Typical price.
- T3 Period - period of the additional indicator T3.The default value is 5.
- Koeff B - value of the coefficient of smoothing of the indicator values.The default value is 0.618.

Indicator signals
The CCI T3 indicator does not differ from other histogram indicators in terms of the principle of operation, namely, the conditions for generating signals. That is, taking into account the presence of the histogram and its signal line above or below the zero level, as well as its color, a position can be opened in the direction with the current trend. If the trend is up, then the position is long, and if it is down, then, accordingly, it is short.
Signal for Buy trades:
- The histogram of the indicator, at least three columns of which are colored with a growth value, crosses the zero level upwards together with the signal line.
After the above conditions match on a certain candle, a long position can be opened. It should be closed after the signal line together with the histogram falls below zero, in which case it should be considered opening a new position.
Signal for Sell trades:
- At least three columns are formed in the indicator window, colored in color with the value of the fall. At the same time, the histogram itself with the signal line drops below its zero level.
Upon receipt of such a signal, a sell trade can be opened on a certain candle. It is logical that it should be closed upon receipt of the opposite conditions, namely, a change in the position and color of the histogram, since at this moment the possibility of opening new positions opens.
Conclusion
The CCI T3 indicator is a very effective algorithm, but at the same time easy to use. And despite the fact that the indicator can be considered a complete system, it is recommended to use additional indicators to increase the accuracy of the signals that will confirm the CCI T3 signals. But the use of the indicator separately is not denied .In order to fully understand the nuances of the indicator, it is recommended to use a demo account first.


