Support and resistance levels are the foundation of almost all forms of technical analysis. They can be viewed as the levels through which the price will pass when the bulls and bears are opposed.
When the market approaches them, some traders expect the price to rebound. Others may anticipate the likelihood of a breakout. Hence, they indicate the likelihood of significant movement. Therefore, determining where these levels are located is a very useful skill. And a good helper in finding pivot levels is the Daily Pivot indicator.
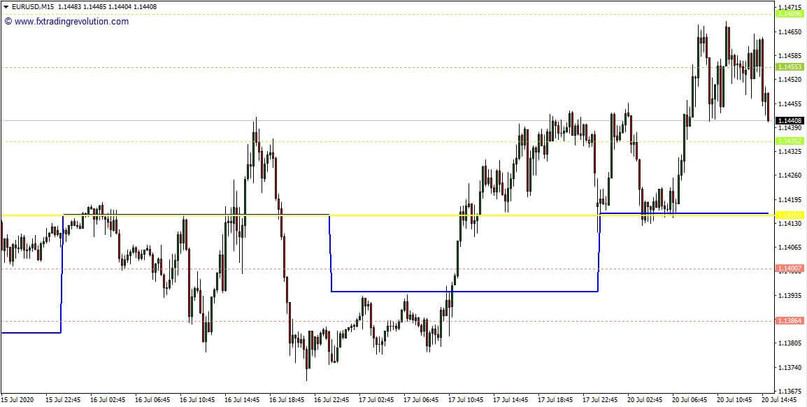
An example of the Daily Pivot Indicator on a chart in MT4
Indicator calculations
Based on the available prices of the OHLC model, a certain base or equilibrium level is calculated. After combining the extremes (HL) of the previous day, the opening (O), closing (C) prices, up and down, the levels are laid.
Their number can be any. In further calculations, both lower, daily, and higher, weekly, and higher timeframes can be used. Signal strength - the reliability of a level is indicated by the coincidence or proximity of several values of pivot points belonging to different timeframes.
Reversals at pivot points (levels) occur according to the principle of the psychology of trading participants. Daily, weekly, annual, and month-sized extremes and closing opening prices for many traders serve as a guideline for placing pending trade orders to enter the market, taking profit levels, or executing protective orders. Periodicals write about the achievement of these prices by an asset, and analysts discuss.
The indicator is based on the following pivot level plotting algorithm:
The base level is calculated, which is the reference level for all further calculations. It is obtained by averaging the two extremes of the previous trading range of the day added to the closing price (divided by three).
Above, the first resistance is built R1 = Pivot level * 2 - the low of the day. Next comes the resistance R2 = Pivot + daily trading range.
- R3 = Previous day high + 2 (Pivot level - previous day low). Below the pivot level, three supports are built using the mirror formulas S1 = Pivot level * 2 - the high of the day.
- R2 = Pivot Level - Daily Trading Range.
- R3 = Previous Day Low - 2 (Previous Day High - Pivot Level).
Indicator signals
Levels R1, 2, 3, and S1, 2, 3 are used by traders to place both protective orders and pending orders to take-profit.
Entry by pending orders is carried out only at the levels that coincide with the levels of higher timeframes.
Conclusion
The Daily Pivot indicator is one of the most useful tools for identifying price reversal points and finding significant levels. The indicator is easy to understand and will perfectly complement the trading arsenal of any trader. In combination with other elements of technical analysis, this tool will bring the trader a good profit and minimize possible losses.
Tip: Can’t open the downloaded archive file (ZIP or RAR)?
Try WinRAR for Windows or The Unarchiver for Mac .
Do you need help with installing this indicator into MT4 for Windows or Mac OS? Our guide HERE will help you.