The Donchian_Channel indicator is a technical analysis indicator that belongs to a group of trend indicators. The indicator was developed by Richard Donchian, a successful Wall Street stock trader.
On the price chart, the Donchian Channel is displayed as the upper and lower bands, thereby forming a channel within which prices are located.
The Donchian channel lines create boundaries that can serve as indicators of current support and resistance lines.
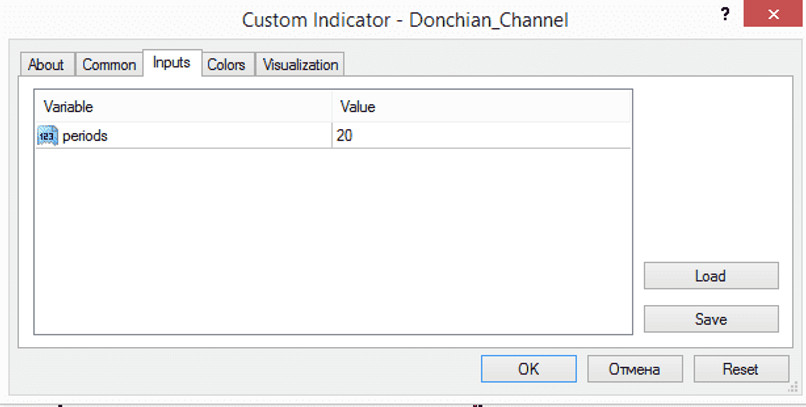
The principle of constructing the Donchian channel lines is quite simple. In the basic settings of the indicator, the user sets the period. By default, its value is 20, since the author of the indicator himself recommended using this value, which correlates with the number of working days in a month. (However, the user can experiment with higher or lower values for the number of time periods.)
The indicator analyzes the chart and looks for local minimums and maximums in each section of 20 candles. The lower boundary of the Donchian channel, located below the price chart, is at the minimum level over the last 20 time periods. Accordingly, its upper boundary is located at the level of a local maximum, which is found within the last 20 candles. If the market fluctuates in a flat, and there is no update of the lows and highs, the Donchian channel becomes horizontal, its lines are aligned.
As soon as one of the last minima or maxima breaks down, the channel expands in the corresponding direction. This is the first sign that the market is again moving towards a trend movement.
In addition to boundaries of support and resistance, the Donchian channel can serve as a kind of indicator of volatility.
During periods of calm, it becomes relatively narrow. When the intensity of price fluctuations increases, the boundaries expand. A similar property can be used to predict the onset of a trend.
As soon as the channel is compressed very much, you should prepare for the beginning of the trend. To work in a calm state of the market, the median line is often used, from which the two main lines are equidistant. When the price movement reaches it and reverses, we can assume that it will continue to the very border.
Installing & Configuring the Donchian Channel Indicator
Installing the indicator on the Metatrader4 trading platform is quite simple. Since the indicator is not included in the standard accessible library of the MT4 trading platform, you can download it on our website.
After a successful download, move the indicator file to the Indicators folder of the MT4 platform. By default, the folder is located in the C: \ Program Files \ MQL4 \ Indicators directory.
Next, open the MT4 terminal (if the terminal was already open during the move, restart it), find the Donchian_Channel indicator in the Navigator window (Views tab), and drag it onto the price chart.

You can change the value of the period, the color scheme on the Inputs tab in the indicator window.

Conclusion
This indicator can serve as a very useful tool for the trader to determine the current possible support and resistance lines, determine the volatility by narrowing the channel, and can be used in combination with other means to determine the continuation of the trend.
Download the Donchian Channel indicator from the button below
Tip: Can’t open the downloaded archive file (ZIP or RAR)?
Try WinRAR for Windows or The Unarchiver for Mac .
Do you need help with installing this indicator into MT4 for Windows or Mac OS? Our guide HERE will help you.


