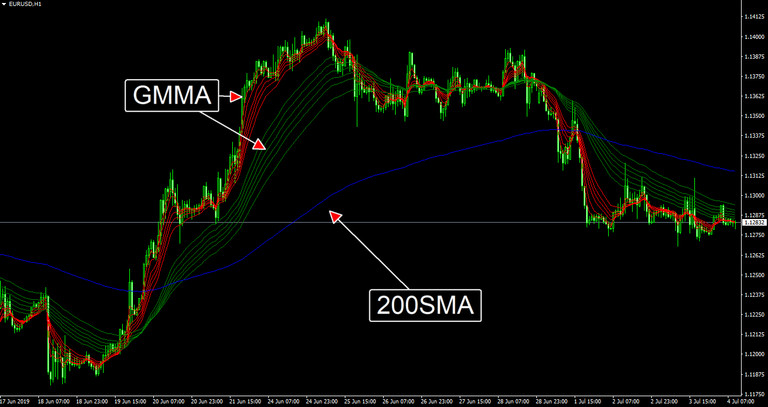
The “GMMA” indicator makes trend judgment very easy by displaying various moving average lines (MAs) on the chart. This improved version of the “GMMA” indicator additionally adds the 200-day moving average (200 MA) to the group of plotted MAs - making it even easier to determine long-term trends.
Here, we introduce a very handy indicator for MT4 that will make the job much easier for many Forex traders.
Apply this indicator to the EURUSD hourly chart
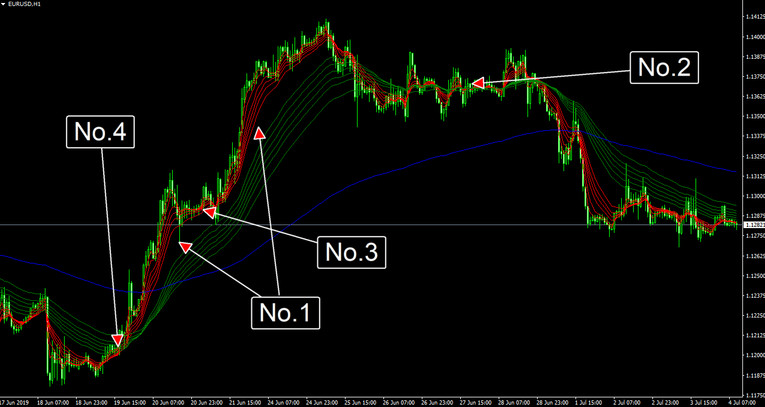
Example of using this indicator. See the text below for more.
GMMA is an abbreviation for “Guppy Multiple Moving Average”. This indicator is named after Daryl Guppy, the trader who invented it. In Japan, it is also called “Composite Moving Average”.
The GMMA indicator displays 12 moving average lines - a group of 6 short-term MAs and a group of 6 long-term MAs. All MAs use the exponential smoothing formula for the calculation. The characteristic and the primary advantage of this indicator is that it makes it much easier to judge trends by displaying all useful MAs together.
The short-term group of MAs is said to represent trading behaviors of speculators, etc. mainly for short-term investments, and the long-term group of MAs is considered to represent the trading behavior of major banks, etc., mainly for long-term investments. The essence of the GMMA is to trade on the side of the big institutional investors such as major banks.
The standard GMMA indicator has a weak point in that there is no ultra-long-term MA. This that we introduce here adds such an MA, namely the 200-day moving average line. In this way, it is also useful for ultra-long-term trend judgment.
Tips for using:
The GMMA indicator is very versatile. You can use it as you like, but here are a few suggestions for making the most out of it.
1. Use for trend judgment
- If all moving averages are rising and falling in the same direction, it indicates a very strong trend (see image No. 1). Conversely, if the moving average line is twisted and is in a spaghetti state (see No. 2 in the image), there is a high probability that the specific Fx pair is in a range market. Thus, it is also a good idea to use this indicator as a filter for when not to trade.
2. Use for joining already existing trends.
- If the short-term MA group touches the long-term MA group, it would be good to buy into or sell into an existing bullish or bearish trend. As the example above shows, if the short-term MA group is twisted, it is a chance to buy and join the existing uptrend (see No. 3 in the image). The same would also be true if a downtrend was in place.
3.Crossover between short-term MA group and long-term MA group
- If the short-term MA group and the long-term MA group cross over (see No. 4 in the image), a trend shift has likely occurred. In this case, it is an opportunity to open and hold a long-term position.
Compatibility: For MT4
Parameters:
- Fast Moving Average" - Defines the periods used for Fast Moving average calculation
- Moving Average 01
- Moving Average 02
- Moving Average 03
- Moving Average 04
- Moving Average 05
- Moving Average 06
- Slow Moving Average" - Defines the periods used for Slow Moving average calculation
- Moving Average 07
- Moving Average 08
- Moving Average 09
- Moving Average 10
- Moving Average 11
- Moving Average 12
- Ultra Slow Moving Average - Defines the peroiods used for Ultra Slow Moving average calculation
Download "GMMA_200MA" for free from the button below
Tip: Can’t open the downloaded archive file (ZIP or RAR)?
Try WinRAR for Windows or The Unarchiver for Mac .
Do you need help with installing this indicator into MT4 for Windows or Mac OS? Our guide HERE will help you.

