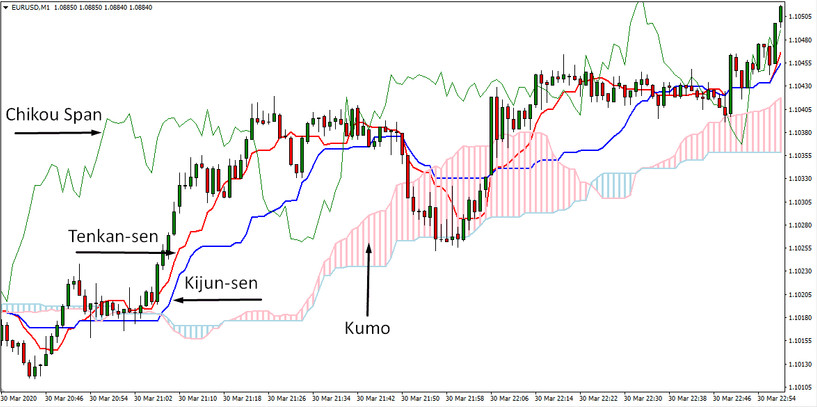
The Ichimoku Kinko Hyo indicator is a technical market indicator developed by the Japanese analyst Goichi Hosoda Ichimoku in the 1930s. The Ichimoku indicator combines several approaches to market analysis and is designed to identify trends, support and resistance lines and generate signals for buying and selling.
The Ichimoku indicator represents five lines plotted on the price chart and the shaded gap between the two of them (Kumo cloud), as shown below. Each of the indicator lines has its own name and economic rationale for the construction.
1. Tenkan-Sen (red line). This line defines a short-term price movement or a small trend (reversal). It is calculated as the first middle interval according to the formula (High + Low) / 2. By default, 9 calculation periods, the greater the angle of inclination, the stronger the short-term trend, also works as a strong support/resistance level, the break of which will be the first reversal signal.
2. Kijun-Sen (blue line). It indicates the direction of a long-term trend and is the main element of the Ichimoku indicator. If the market goes above the line, there is a high probability that the uptrend will continue, and you need to look for confirmation of a buy signal. Conversely, below it will be a continuation of the downward movement, and it is worth considering only sell positions. It is a moving average with a period of 26; when changing the default value, it is necessary that the new period be at least 3-4 times larger than the Tenkan Sen.
3. Senkou Span A (top border of Kumo). The first or upper leading line of the Ichimoku indicator, which is the middle of the range between Tenkan-Sen and Kijun-Sen, shifted forward by its period.
4. Senkou Span B (down border of Kumo). The second “lower” lead line calculated as the middle line, shifted forward by the Kijun-Sen period (52 by default). The Ichimoku indicator displays a shaded area between Senkou Span A and B called the “cloud” (Kumo). If the price moves inside it, this means a period of consolidation, the borders are considered as strong resistance confirming the breakdown of other lines. The upper one confirms the uptrend, the lower one - the downtrend.
5. Chikou Span (green line). This line is a close-down price chart for the Kijun-sen period. Like the cloud is used for final confirmation of the signal and is an almost complete analogue of Momentum’s current market dynamics.
Tips for how to use
The exchange analyst Ichimoku, who created the Ichimoku Kinko Hyo indicator, believed that one should enter only according to the signal that is supplied by the Chikou Span line, setting Stoploss outside the cloud border, in the opposite direction from the entrance.
Example: if the trade is conducted inside the cloud in the direction from the bottom up, then Stoploss is set under the lower border of the cloud, and, conversely, above the upper border, if the trade is conducted from top to bottom.
It is believed that the most powerful indicator on Forex is the signal given by the Ichimoku indicator first on the four-hour charts and already after on the hour and minute charts.
Along with this, the breakdown signal by a graph of such a line as Senkou Span B is considered the strongest. Next is the Chikou Span, and only after that are equal in strength - the signal of three lines, the “dead” and “golden” cross. As a result, we have an excellent indicator, which gives the probability of a correct forecast, equal to 65 percent, which is perhaps quite good, given the instability and volatility of the financial market.
Conclusion
When applied correctly, the Ichimoku indicator is a fairly powerful tool for predicting price movements. The author himself and the creator of the indicator recommended analyzing the signals supplied by his indicator in close connection with the information obtained during the analysis of the candlestick chart.
Download the Ichimoku Kinko Hyo indicator from the button below
Tip: Can’t open the downloaded archive file (ZIP or RAR)?
Try WinRAR for Windows or The Unarchiver for Mac .
Do you need help with installing this indicator into MT4 for Windows or Mac OS? Our guide HERE will help you.


