Prediction of price dynamics can be carried out by various factors. For example, you can predict in which direction the next quote movement will take place, or at what level the current trend will end. But the Keltner channel shows what price range the quotes will be in the near future.
The Keltner channel is an indicator consisting of moving averages formed around the EMA and tied to the volatility of the instrument. This indicator is very similar to Bollinger Bands, which uses standard deviation to change the channel width. Instead of the standard deviation, the Keltner Channel uses the ATR indicator (Average True Range).
The Keltner channel is a trend indicator used to search for reversals in the breakdown of its borders.
Indicator calculations
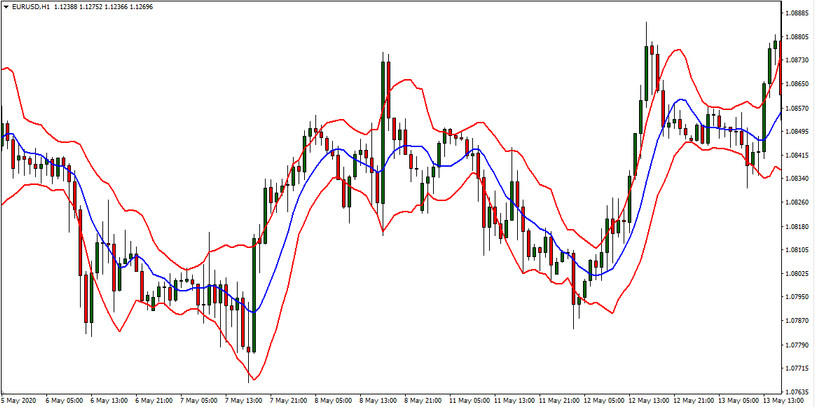
Its construction consists of calculating the moving average (MA) and the distance from it, at which the upper and lower boundaries (red lines) will be located. This distance is directly proportional to the value of the smoothed true trading range. The displayed MA (blue line) represents the middle of the Keltner channel.
Indicator Settings
In order for the displayed in-channel space to describe the price dynamics as accurately as possible, it is necessary to assign the corresponding values to the input variables. Moreover, the most optimal value is a certain numerical range.
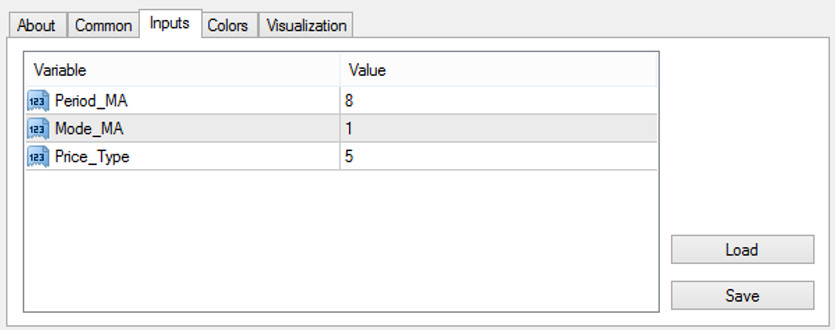
The indicator has the following parameter settings:
Period_MA is the length (in candles) of the period whose prices are used in calculating the central moving and channel width. This is the most important parameter in this indicator. It is correct if the channel follows the dynamics of the quote as accurately as possible - without delay and a strong response to noise.
Mode_MA - the type of calculated central MA (can be simple, exponential, weighted average, etc.)
Price_Type - price used in the calculation of Moving Average (it can be like the price of opening, closing, minimum, maximum, average, typical, etc.)
Indicator signals
Observing the movement of the quote relative to the Keltner channel, you can see that when you exit it, the quote often tries to return to its limits. This property is based on trade through Keltner channels. In this case, breakdowns of the upper and lower boundaries of the Keltner channel will be considered unfiltered signals.
Conclusion
Like any other channel indicators, the Keltner Channel has the same positive and negative sides, just some of them are less pronounced. However, the Keltner channel is an excellent trend indicator, originally developed specifically for the strategy of entering trend transactions after pullbacks.
The indicator is ancient, and during its existence, acceptable strategies have been formed both for markets in a trend and for markets moving sideways. And this makes the Keltner channel a universal tool, especially when correctly combined with other indicators and candlestick patterns.

