When creating indicators, one of the most common problems is finding a balance between the amount of smoothing and, as a result, the indicator lag.
If you increase the smoothing, then the indicator becomes smoother, the signals are more verified, then the lag increases, which often leads to missing good entry points and moments of the beginning of interesting movements. If the smoothing is insignificant, then the indicator, subtly sensing price changes, will give out many false signals, which will not benefit the trader's trading system.
The authors of the Laguerre indicator created it with an emphasis on solving the problem of balancing smoothing and lags. The formula behind the calculations allows you to estimate possible future datasets based on the minimum input.
Laguerre settings
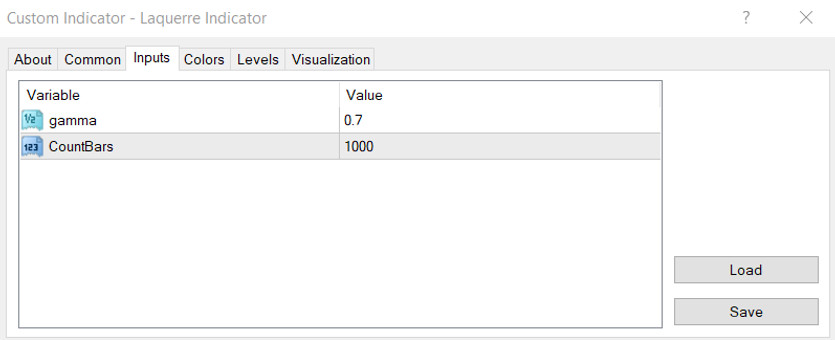
There are two parameters available for change in the indicator settings:
gamma - this value is used to calculate the indicator levels. By increasing the gamma, you can make the indicator smoother. The default is 0.7.
CountBars - how many bars will be taken for the calculation. The default is 1000.
Indicator signals
This indicator is built on the basis of a moving average, going through a lot of transformations and smoothing.
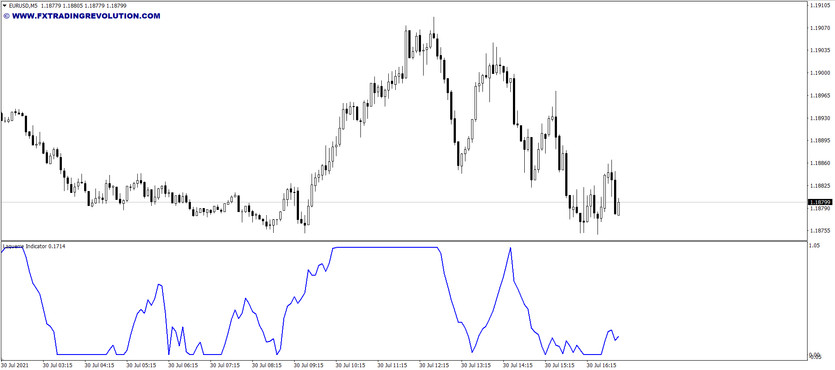
But it works the same way as oscillators. It has its own chart located in the "basement" below the price chart.
The indicator line fluctuates on a vertical scale in the range from 0 to 1.
And there are several classic oscillator approaches that you can trade with Laguerre.
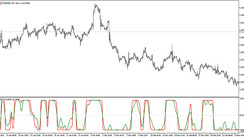
First, you can open buy when the Laguerre crosses the 0.2 level from the bottom up and enter sells if the line crosses the 0.8 level from top to bottom, working with the intersection of these levels as overbought and oversold areas.
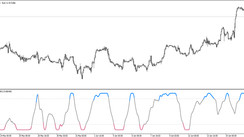
Secondly, you can use Laguerre as a filter. With this approach, it is worth considering the possibility of buying only if the indicator is above the average level of 0.5. And sales can only be relevant if the line is below the 0.5 level. That is, 0.5 will act as a watershed between upward and downward movements.
Thirdly, the readings of the indicator can also be used to determine the moment of exiting trades. So, if the line crosses the level 0.8 or 0.5, then you can already exit the purchases if they were open. And exit from sales when the line crosses either 0.2 or 0.5 from the bottom up.
Conclusion
The Laguerre indicator is a pretty interesting tool. It can be used to obtain both entry points and exit points. It can be used as a main tool and as a filter for signals from other indicators or graphical analysis tools.
The combination of several Laguerre with different settings can already represent an independent trading system.
Although it is a trend indicator, it still works on the principle of an oscillator and gives fewer false signals than most of the standard indicators.

