Monthly charts are very important for identifying long-term trends in the Forex market. This "Month_HighLow" indicator for Metatrader 4 displays the high and low prices the monthly charts.
If you use this indicator, it will be easier to find potential resistance and support zones on all the lower timeframes. Continue reading to find out more about the importance of the monthly high/low prices and also download this indicator for free at the bottom of the page.
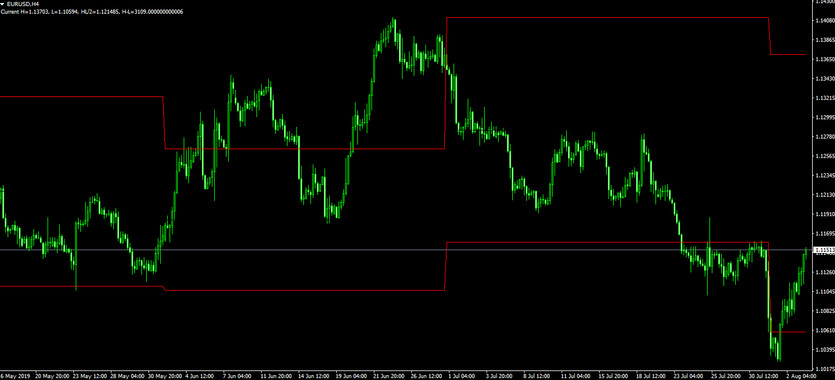
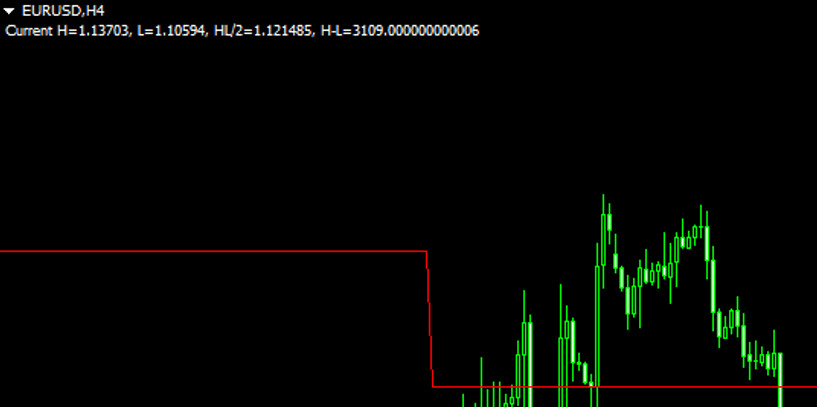
The indicator plotted on the EuroDollar 4-hour chart
You can also display other information on the monthly chart
This indicator shows the high and low prices of the monthly candlestick bars on the other timeframes. The high/low of the previous monthly candlestick is displayed. For example, when looking at a daily chart, the highest and lowest prices in the monthly chart one month ago are displayed on the right.
Tips on how to use:
1. The price can often bounce or reverse on lower timeframes due to the lows and highs of the monthly chart being used as potential resistance and support zones. For this reason, it can be useful to use the lines displayed by this indicator as a potential resistance or support area. If the price actually rebounds around the line, it is recommended to consider placing a buy trade.
2. If the lines used to show the monthly highs/lows are narrow, there is a possibility of a range market. Depending on the timeframe, in this case, it is better to trade using a trading strategy that works effectively within the range.
Compatibility: MT4
Parameters:
- Show_Comment - Whether to display comments
- Number_Of_Candlesticks - Defines how many candlesticks of MN1 will be shown
Download the "Month_HighLow" indicator from the button below
Tip: Can’t open the downloaded archive file (ZIP or RAR)?
Try WinRAR for Windows or The Unarchiver for Mac .
Do you need help with installing this indicator into MT4 for Windows or Mac OS? Our guide HERE will help you.