Heiken Ashi comes from the Japanese term "Heikin Ashi", which means middle bar.
The Heiken Ashi indicator is a special type of candlestick used for building candlestick charts. It differs from standard Japanese candles in more vivid and understandable visualization and in the strength of the signal given about a possible change in the direction of the trend.
This indicator is usually included in the latest builds of the Metatrader 4 trading terminal. You can also download the Heiken_Ashi indicator at the end of this article.
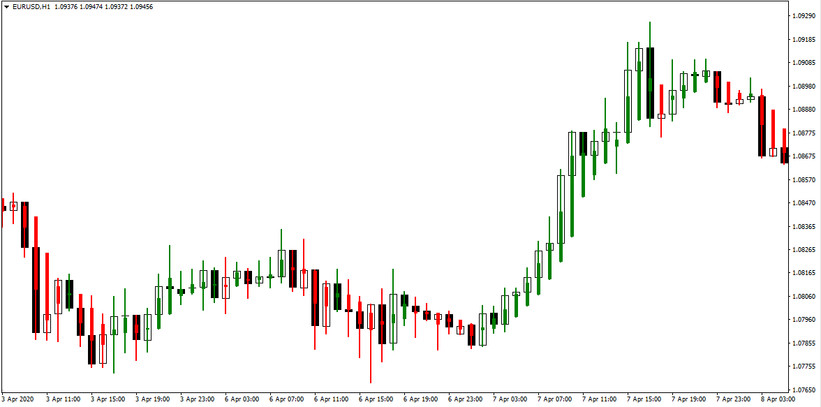
Figure 1: Heiiken Ashi Candles
During periods of volatility, as the price fluctuates, bullish and bearish candles alternate. Movement interferes with trending. This is where Heiken Ashi comes to the rescue. To solve this problem, modified candles are used. Heiken Ashi candles are similar to ordinary ones, but instead of using values to open, close, high and low, they use average values for each of these four exponents.
The Heiken Ashi formula used to obtain these averages is as follows:
- Opening a candle is based on the method: (opening the previous bar + closing the previous bar) / 2
- Closing is built according to the method: (opening the previous + maximum + minimum + closing the previous) / 4
- Maximum = maximum value of the maximum, opening or closing of the current period
- Minimum = minimum value from the minimum, opening or closing of the current period
A trader working with the Heiken Ashi indicator should focus on two specific signals:
- Green candle without a lower shadow, signals the beginning (continuation) of the bull trend
- A red candle without an upper shadow, signals the beginning (continuation) of the bearish trend.
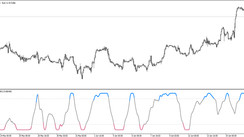
Figure 2: Example of a bull trend
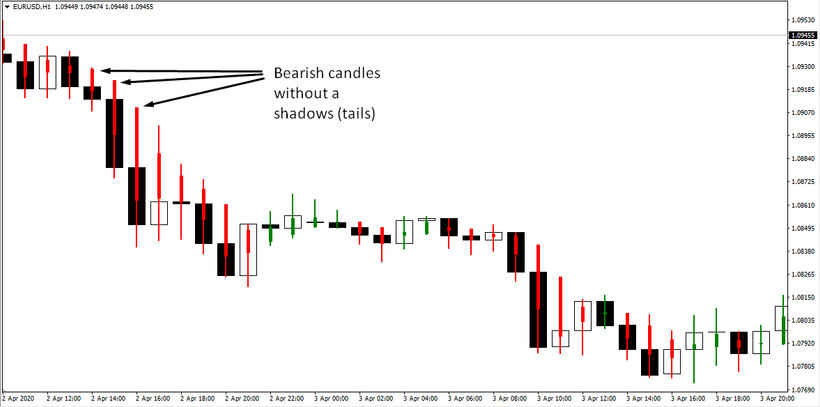
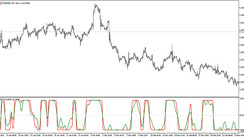
Figure 3: Example of a bear trend
This indicator is recommended for use on small time frames up to H1.
Conclusion
From the Heiken Ashi construction methodology, we can conclude: when we have full-bodied candles, in which, for the most part, the tails are directed in one direction - towards the current trend, and on the other side of the candles there are no tails, then we are dealing with a strong trend.
In Figure 2, we can observe a bullish trend:
- several candles of the same color
- tails are directed towards the trend, long tails
- on the opposite side of the tails - practically not
- And, the candles are full-bodied with large bodies
This means that the trend is strong.
Similarly, for a bearish trend:
- Candles of the same color
- No tails on the opposite side
- And long tails in the direction of the trend
A change in trend is usually characterized by candles that look like doji - a small body with long tails (wicks) on both sides of the candlestick. And, near such candles, you can already observe a change in trend. But, of course, not always.
As for directly trading, the fact is that Heiken Ashi candles have a disadvantage in that they are late. Since they average prices, they show us a trend, give us the opportunity to hold on to it for as long as possible, but they are late. Therefore, they are well suited for volatile pairs, and for trading on small timeframes, up to H1. Timeframe H1 is the maximum on which Heiken Ashi can be traded. For trading on H-4 and daily charts, they are not suitable.
We recommend using the Heiken Ashi indicator in conjunction with other signaling systems.
Download the Heiken-Ashi Indicator from the button below
Tip: Can’t open the downloaded archive file (ZIP or RAR)?
Try WinRAR for Windows or The Unarchiver for Mac .
Do you need help with installing this indicator into MT4 for Windows or Mac OS? Our guide HERE will help you.

