Candles' charts invented in Japan have become the de facto standard for displaying price movements on all popular trading platforms. For many years now, their patterns have been studied and successfully applied, despite high-frequency trading and other technical innovations. However, they also have worthy alternatives, such as Renko price bars.
Despite the fact that the timeline of graphs is present in all terminals, in reality, it does not always have practical meaning. All news advisors and strategies, unlike Renko, are tied exclusively to time, and no matter how the price behaved before and after the fundamental event.
Periods of increased activity at the opening and closing of trading sessions, when charts show numerous sharp price impulses and indicators begin to give mostly false signals, also last a limited time and can also be classified as a fundamental background.
With technical and graphical analysis, the opposite is the case - market entry is based on price data, and it does not matter how long the graphical analysis pattern is formed, moving averages intersect or the oscillator enters overbought/oversold zones. In this case, the time factor can be completely ignored on a “synthetic” chart, such as the Renko chart. This indicator was created to build these charts.
Building Renko Candles indicator values
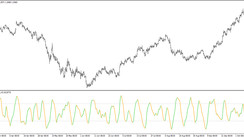
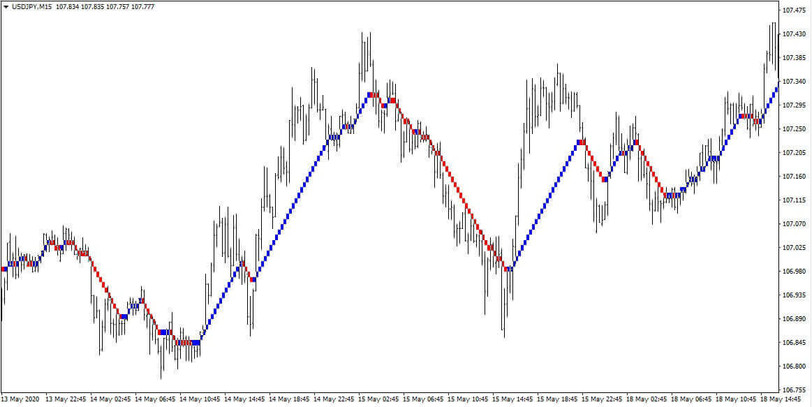
In the Renko Candles indicator, as well as in many other indicators based on Renko values, candles (or bricks, as they are called) are built based on the value passed by the price. They, unlike classic Japanese candles, are not tied to time. A new “brick” appears on the chart only if the price movement exceeds the set values.
Renko Candles indicator parameters
This indicator has only two parameters:
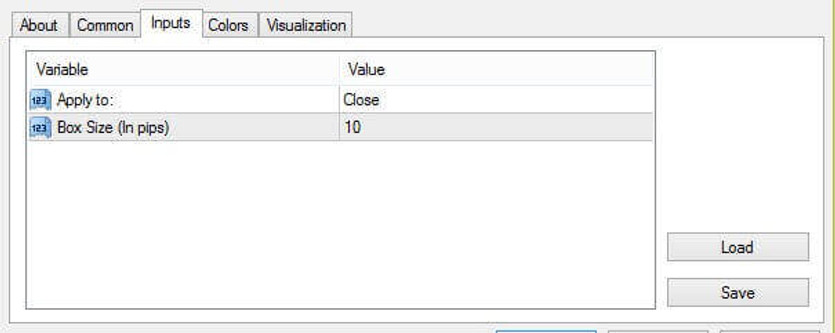
Signals of the Renko Candles indicator
Renko chart that is built using this indicator can serve the trader to more accurately determine the patterns of graphical analysis. Thanks to Renko's charts, this process is greatly simplified.
Conclusion
Renko Candles indicator is a simple and convenient tool for plotting Renko charts right on the price chart. Thus, the comparison and determination process is visually simplified. Using this indicator, you can build various trading strategies using it as an auxiliary tool. You can find some examples of trading strategies using the Renko Candles indicator on our website in the Strategies section.
Download the Renko Candles Indicator for Metatrader 4 from the button below
Tip: Can’t open the downloaded archive file (ZIP or RAR)?
Try WinRAR for Windows or The Unarchiver for Mac .
Do you need help with installing this indicator into MT4 for Windows or Mac OS? Our guide HERE will help you.