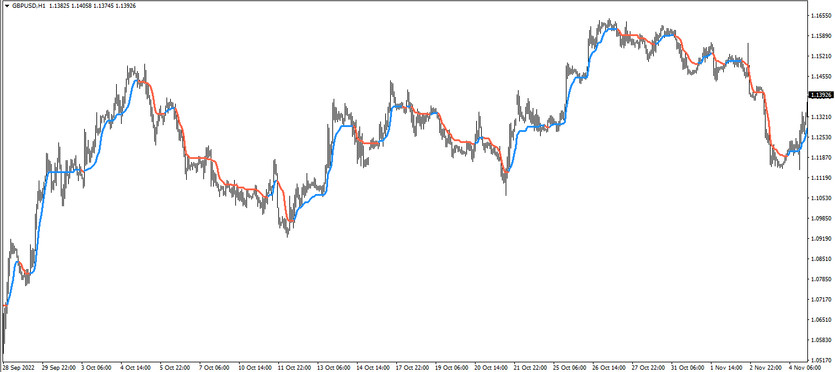
The AMA STL Color indicator is a trading algorithm based on the functioning of the modification version of the standard moving average. Thus, based on the use of two moving averages of different periods, the indicator is used in trading for the same purposes as its main version, namely to identify the current trend and search for the optimal point for opening positions during its period. The indicator itself is presented in the main window of the price chart in the form of a moving line, which, depending on a certain trend, changes its color and direction. Thus, the indicator signal in determining the trend, and thus opening trades, is the change of color and direction of its line.
The AMA STL Color indicator does not limit the choice of timeframe and currency pair, since these given values do not affect its effectiveness.
Input parameters
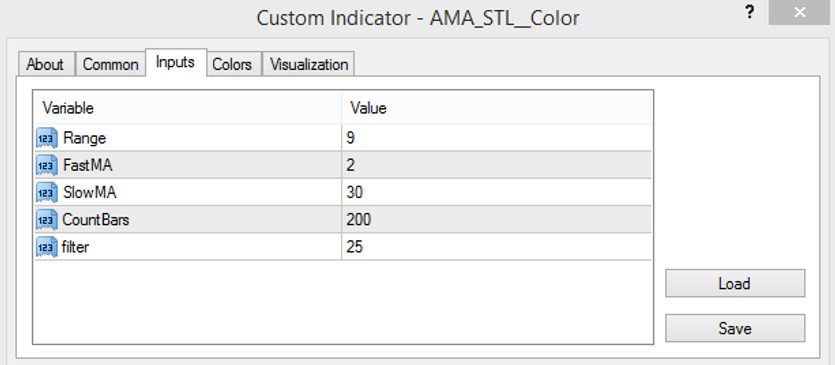
There are five input parameters in the AMA STL Color indicator settings, changing the values of which will directly affect the technical operation of the indicator. The Indicator Colors section can be used to change the color or thickness of its line.
- Range - parameter responsible for the length of the indicator line. The default value is 9.
- FastMA - fast moving average period of the indicator. The default value is 2.
- SlowMA - value of the period of the slow moving average. The default value is 30.
- Count Bars - parameter responsible for the number of bars to which the indicator calculation will be applied. The default value is 200.
- filter - parameter, which is responsible for the value of the indicator signal filtering period. The default value is 25.

Indicator signals
The AMA STL Color indicator is used in trading to determine the current trend, and then to open a position in its direction. That is, before opening a certain trade, it should be determined the current market trend by comparing the color value and the direction of the indicator line. And if it matches on a certain candle a certain combination of these values, a trade can be opened, due to the presence of a market movement.
Signal for Buy trades:
- The indicator line goes up and at the same time has a color with a growth value.
After the appearance of such values, a long position may be opened on the signal candle, due to the presence of an upward movement. Such a position should be closed after receiving the opposite conditions from the indicator, namely, a change in the color or direction of the line. This will indicate a change in the current trend and the formation of a new one, allowing opening new trades.
Signal for Sell trades:
- The indicator line, colored with the fall value, goes from top to bottom.
A sell trade can be opened immediately after the appearance of such indicator conditions. It should be closed when these line values change, since the current downtrend is most likely to change, and this will allow considering the possibility of opening new positions.
Conclusion
The AMA STL Color indicator is quite effective not only because it uses two moving averages at once, but also due to the presence of a filter that allows making its signals more accurate. In addition, it is very easy to use, and therefore suitable even for novice traders. However, for in order to verify the correct use of it and the definition of signals, it is recommended to first use a demo account.
You may also be interested The DPO Histo Trading Indicator for MT4


