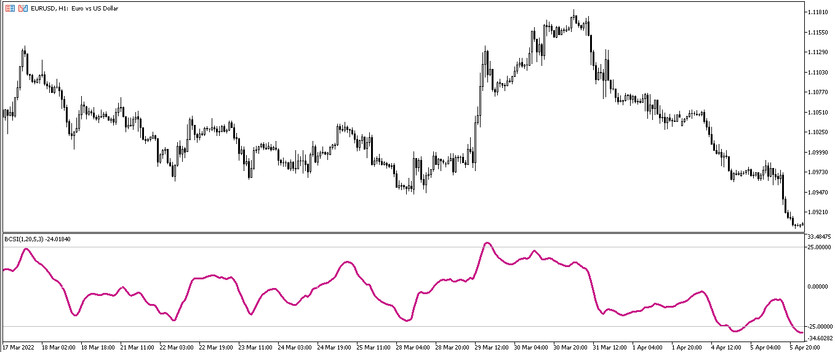
The Blau Candlestick Index is a trading indicator that is used to calculate the current market position and find the optimal points for opening positions. The indicator is presented in the lower window of the price chart as a moving average, the calculations of which go through three stages of smoothing, which makes the indicator more accurate in signals, as well as two signal levels that allow determining if the market is in the overbought or oversold zone by crossing them with the indicator line. Thus, we can say that the indicator can be used for various trading purposes: to identify the current trend, to determine if the market is in the oversold or overbought zone and search for the optimal moment to open positions.
The Blau Candlestick Index indicator does not lose its effectiveness and works equally well on all timeframes, with all currency pairs.
Input parameters
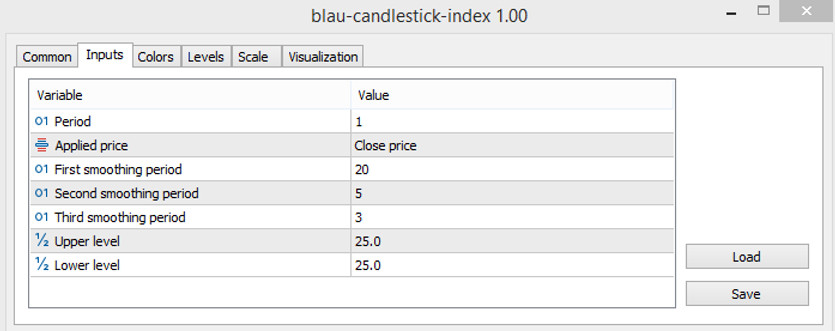
The Blau Candlestick Index indicator settings consist of seven input parameters that perform the technical work of the indicator, as well as several sections, such as Colors, which is responsible for the color scheme and thickness of the indicator values, and Levels, which is responsible for adding signal levels to the indicator window, in addition to those already added - 25 and 25.
- Period - value of the indicator period. The default value is 1.
- Applied price - the type of price to which the indicator calculations will be applied. By default, it has the Close price value.
- First smoothing period - the period of the first smoothing of the indicator values. The default value is 20.
- Second smoothing period - value of the second smoothing of indicator calculations. The default value is 5.
- Third smoothing period - the third smoothing of the indicator values. The default value is 3.
- Upper level - value of the upper signal level of the indicator. The default value is 25.0.
- Lower level - period of the indicator's lower level. The default value is -25.0.
Indicator signals
To use the Blau Candlestick Index indicator in practice as an assistant to determine the trend and find the optimal moment to enter the market, no particular effort is required. The main thing in trading using the indicator is to follow the direction of the line and its location relative to its levels. If the line moves up, the trend is up, if it is down, then a downtrend, and in accordance with this, a certain position can be opened.
Signal for Buy trades:
- The indicator line that has broken through the level of -25.0 starts moving up to its level of 25.0.
Immediately after the line breaks through the level of 25.0, a long position may be opened, due to the presence of an upward trend in the market. Such a trade should be closed after the direction of the indicator line changes, since in this case it is possible to open new trades.
Signal for Sell trades:
- The indicator line, after breaking through the level of 25.0 upwards, starts moving downwards, to the level of -25.0.
After the indicator line falls below the level of -25.0, a short position may be opened, as a downtrend is determined in the market. Such a trade should be closed immediately after the indicator line changes its direction, in which case it can be considered opening new trades.
Conclusion
The Blau Candlestick Index is a very simple and logical trading indicator. Despite the good result of using it, it is recommended to use the indicator with additional tools that will allow generating signals more accurately. However, the possibility of using the indicator as the only one is not denied. In addition, before using the indicator in practice, it is recommended pre-use a demo account.

