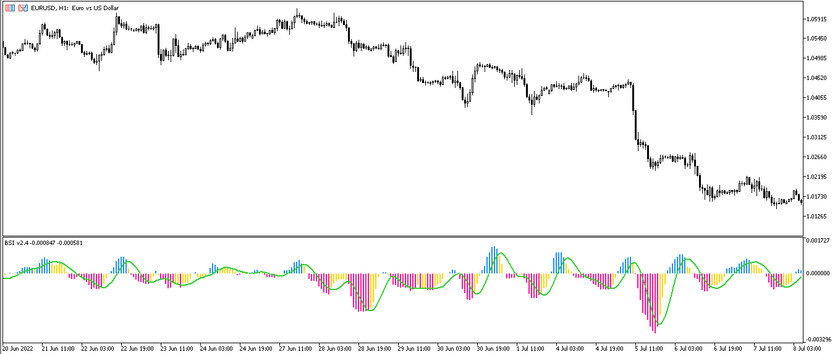
The Bounce strength indicator trading indicator, which can also be known as BSI, is often used in trading to detect the presence of a trend of its strength, as well as its absence, that is, the presence of a flat in the market. Thus, after determining the current trend using this indicator, it can be identified the best moment to enter the current market. The indicator is presented in the lower window of the price chart in the form of a histogram, which changes color depending on a certain movement, as well as an additional signal line, which, like the histogram itself, changes its position relative to level 0. And thanks to taking into account all changes occurring with the indicator, it can be easily determined the current trend and opened a position in its direction.
Input parameters
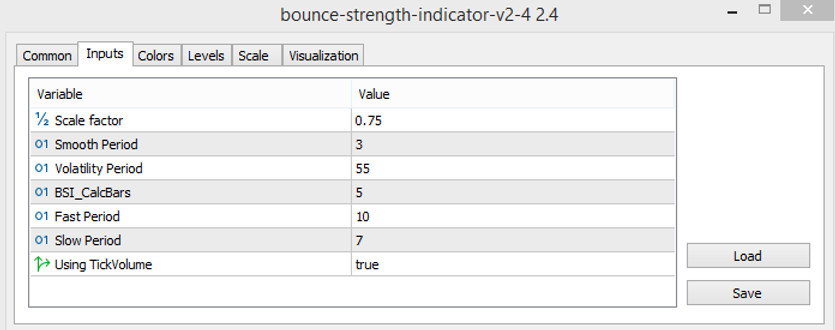
The Bounce strength indicator has seven input parameters in its settings, which in one way or another affect the performance of the indicator's calculations. In addition, its settings have sections responsible for the color visualization of the indicator, as well as adding additional signal levels to its window, in addition to the already added level 0.
- Scale factor - parameter for uniform weighting of indicator values. The default value is 0.75.
- Smooth period - period for smoothing the indicator values. The default value is 3.
- Volatility period - period related to the market volatility value. The default value is 55.
- BSI CalcBars - the number of bars to which the indicator calculations will be applied. The default value is 5.
- Fast period - period of the fast moving average of the indicator. The default value is 10.
- Slow period - the period of the slow moving average. The default value is 7.
- Using tick volume - parameter responsible for using the calculations of the tick volume indicator. By default, it is set to true

Indicator signals
The Bounce strength indicator is very easy to use in practice, since the scheme of this algorithm is very simple. Bounce strength indicator signals are generated according to the principle of all histogram indicators under several conditions - when the histogram changes its color, direction relative to the signal level or location relative to the signal line.Thus, when the desired combination of these conditions appears, a certain trade can be opened, taking into account the current trend. If, on the market, by coloring the histogram in a neutral color, a weakening of the trend or its change is determined, then no trades should be opened, and all old ones should be closed.
Signal for Buy tades:
- The histogram of the indicator is colored with the growth value, and, like the signal line, it is located above the 0 level.
After at least three columns acquire a color with a growth value, taking into account the remaining conditions, a long position may be opened. It should be closed as soon as the indicator histogram changes color, which may indicate a weakening of the current trend and the possibility of a trend change, which will allow opening new trades.
Signal for Sell trades:
- The histogram, together with its signal line, is below level 0, while at least three of its columns have a color with a falling value.
Upon receipt of such a combination of conditions, a sell trade can be opened on a certain candle. Such a trade should be closed as soon as the histogram changes its hue, which may indicate a weakening of the current trend or its end, which makes it possible to open new positions.
Conclusion
The Bounce strength indicator is a very logical, easy-to-use and effective trading assistant that allows quickly and accurately determining the current trend and determining the best moment to enter the current market. But still, for the sake of own confidence in trading, a good practice on a demo account is recommended.


