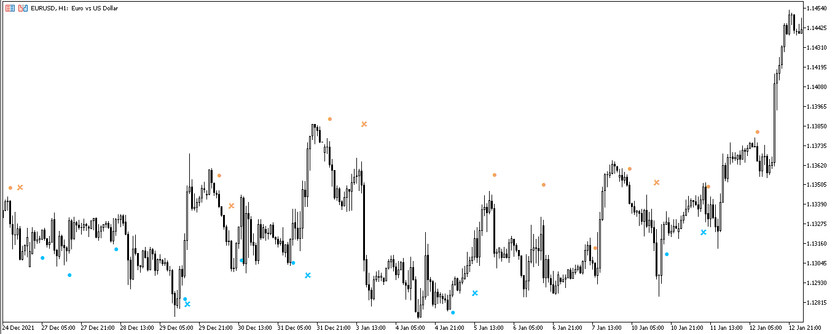
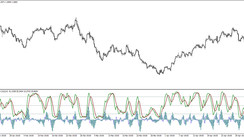
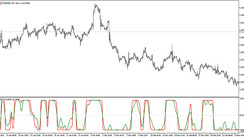
The Double RSI is a signal indicator designed to determine the optimal entry and exit points for trades. This indicator is a small strategy formed by the interaction of two RSI indicators and two MA indicators with different period values. After making calculations, the indicator will be indicated on the price point and mark on the chart, taking into account which it should be opened or closed a certain position after receiving a signal.
The indicator is suitable for trading on absolutely any timeframe, using any currency pair.
Input parameters
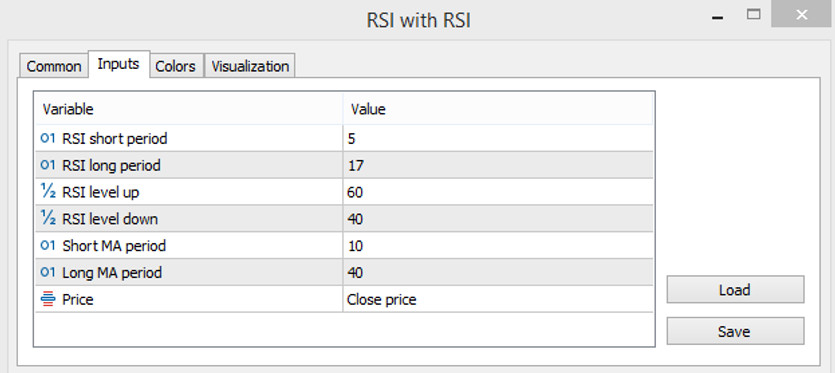
In addition to the parameters applied to the system of two lines of the RSI indicator, in the settings of the Double RSI indicator there are also moving averages parameters, which also play a role in the indicator's calculations. In general, the indicator has seven input parameters.
- -RSI short period-period of the fast line of the RSI indicator. The default value is 5.
- -RSI long period-value of the period of the slow RSI line. The default value is 17.
- -RSI level up - upper level value of both RSI lines. Default value is 60.
- -RSI level down-parameter of the lower level of RSI indicators. The default value is 40.
- -Short MA period-period of a short, that is, fast moving average. The default value is 10.
- -Long MA period-value of the period of the slow moving average. The default value is 40.
- -Price-price to which the general calculations of the indicator will be applied. By default, it is set to Close price.
Also in the settings it can be changed the width and colors that will indicate the signal points.
Indicator signals
Due to the presence of signals, the conditions for the operation of the Double RSI indicator are greatly simplified. On the chart, namely above or below certain bars, points and marks are displayed, indicating the direction of the trade with their color, it is logical that their formation will be considered an indicator signal. And at the end of trading, a mark will appear on the chart, after the formation of which the position should be closed.
Signal for Buy trades:
- -Before a point with a growth value is formed, a label with a fall value should appear on the chart, indicating the end of a downtrend and the beginning of an uptrend.
- -A point should form under a certain bar, indicating growth.
After the appearance of a point with a growth value, a signal will be generated, upon receipt of which a long position can be opened. A long position should be closed if a mark with a growth value appears on the chart, which characterizes the end of an uptrend.
Signal for Sell trades:
- -After the appearance of a label with a fall value, an upward trend is observed in the market.
- -A point with a falling value is formed above a certain candle.
After receiving such a signal, a sell trade can be opened, which should be closed after the formation of a mark with a fall value, this will indicate the end of a downtrend in the market.
Conclusion
The Double RSI indicator is very simple and convenient to use, while being very profitable. Due to the presence of points and marks indicating the point of opening and closing positions, the indicator can be used even by beginners. Being universal, the Double RSI indicator is suitable for both short-term, and for long-term trades. To fully master the indicator, practice on a demo account is required.

