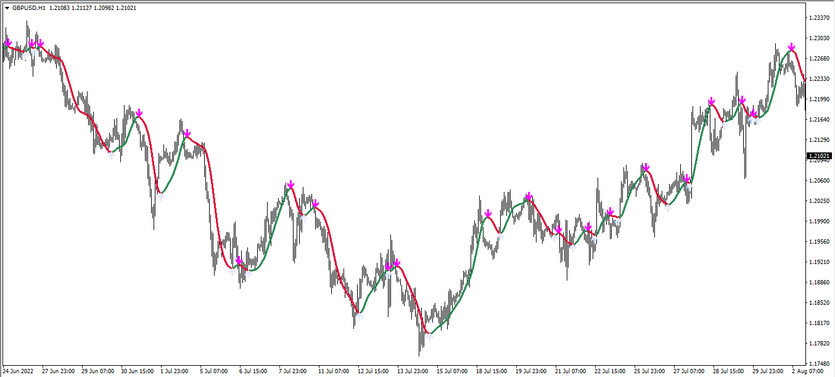
The HMA Trend Arrows TT is a special trading algorithm that is used to trade with the trend using special signal notifications that are formed by the interaction of moving averages. The indicator is displayed directly on the price chart in the form of a moving line, which, under certain market conditions, acquires some or color and direction. At the same time, the chart also has arrows indicating the direction of the current trend, they are located above or below the indicator line, and just like it has a certain color and direction. Thus, this indicator is used to open trades during the period a certain trend, which is characterized by the signs of the indicator.
The HMA Trend Arrows TT indicator can be used on any timeframes, with any currency pairs, as it is equally effective when choosing any values.
Input parameters
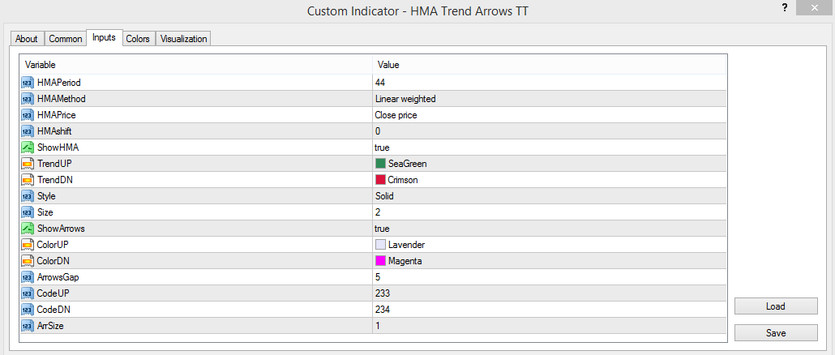
The HMA Trend Arrows TT indicator has a fairly detailed list of input parameters included in its settings, which in turn also have separate sections. Its settings consist of both parameters that affect its technical operation, and those that only affect its visualization factors. At the same time, a separate Colors section also does not affect its technical work, but only its color gamut and thickness of values.
- HMAPrice - HMA indicator period value. The default value is 44.
- HMAMethod - smoothing type of moving average to use. Default is Linear weighted.
- HMAPrice - price type that will be used to calculate the moving average. The default value is Close price.
- HMAshift - deviation of indicator values. The default value is 0.
- ShowHMA - parameter used to display the moving average on the price chart. The default value is true.
- TrendUP - line color that characterizes an uptrend. The default is Sea Green.
- TrendDN - color of the line with a downtrend value. The default value is Crimson.
- Style - Arrow visualization type. The default value is Solid.
- Size - the size applied to the indicator line. The default value is 2.
- Show Arrows - parameter responsible for displaying arrows in the indicator window. The default value is true.
- ColorUP - color of arrows indicating long positions. Default value is Lavender.
- ColorDN - color of arrows with falling value. Magenta by default.
- ArrowsGap - value is the distance of the arrows from the price chart. The default value is 5.
- CodeUP - arrow visualization type with uptrend value. Default value is 233.
- CodeDN - code of the arrow with the fall value, which is responsible for its visualization. The default value is 234.
- ArrSize - size of indicator arrows. The default value is 1.

Indicator signals
The HMA Trend Arrows TT indicator is used to trade with the trend, so before opening a certain trade, the current market trend is first determined. The direction of the current trend is determined using the color values and the direction of the moving line, and the trade itself is opened after the arrow appears on the chart. And accordingly, if the trend is up, buy trades are opened, and if the trend is down, sell trades.
Signal for Buy trades:
- The indicator line moves up and has a color with a growth value. An arrow appears under the signal candle, which has a color with a growth value and points up.
After the appearance of such a combination of conditions, a long position can be opened on the candle on which the arrow appears, due to the presence of an uptrend in the market. Such a trade should be closed by placing a stop loss order under the formed arrow, after the appearance of reverse conditions from the indicator, namely after changing the color line or after the formation of the next candle. This may indicate a possible change in the current trend, which will allow considering opening new positions.
Signal for Sell trades:
- The indicator line, colored with the fall value, is moving down. An arrow with the fall value should appear on the signal candle, pointing down.
A sell trade can be opened on a signal candle, upon receipt of such conditions that characterize a downtrend in the market. Stop loss is set above the formed arrow. Such a trade should be closed after receiving the opposite conditions from the indicator, which will indicate a change in the current trend. After that, it will be possible to consider opening new trades.
Conclusion
The HMA Trend Arrows TT indicator is a very efficient and accurate trading algorithm that allows trading during a certain trend in the market. It can be used even by beginners due to its ease of use. However, before trading on a real deposit, it is recommended to use the indicator on a demo account.
You may also be interested The MBFX Timing trend trading indicator for MT4


