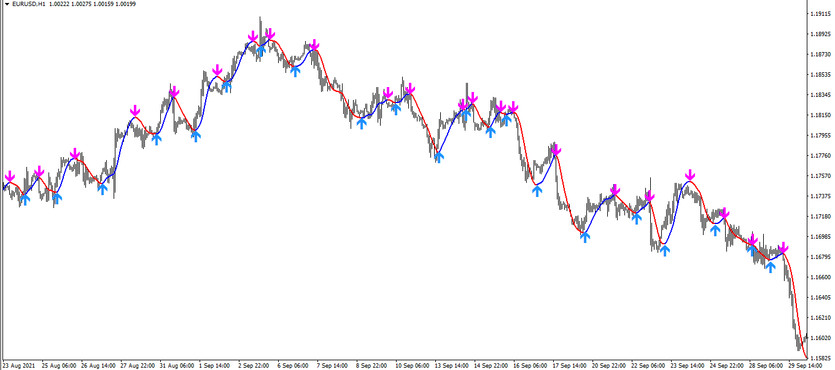
The Hull Moving Average Arrows indicator, also known as HMA Arrows, is used to identify the direction of the current market trend and look for opportunities to open positions at the moment of a certain trend. The indicator's calculations are based on the use of the moving HMA, which serves to quickly determine the direction of the trend. When making calculations, and thus obtaining certain market conditions, the indicator draws an arrow on the chart that indicates the direction of the trade, and only then generates a signal in a convenient and predefined form.
The indicator itself is presented on the chart in the form of a moving average, which under certain conditions is painted in one of two colors, and arrows located on both sides of it, which also, under certain conditions, have a certain color and direction. For own convenience, it can be canceled in the indicator settings the presence of arrows or moving arrows on the chart. The indicator is suitable for working on any timeframe, with any currency pair, as it shows good results regardless of the selected chart.
Input parameters
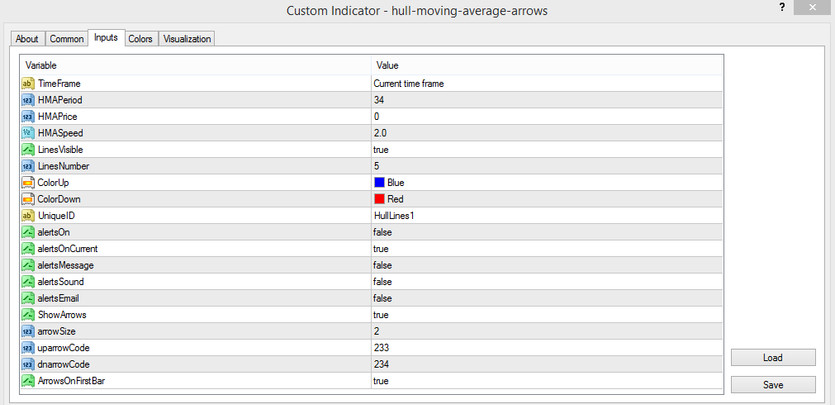
The HMA Arrows indicator consists of a large number of input parameters, most of which are responsible for the systematic work, as well as the visualization and signaling of the indicator. Each of the changed parameters to a small or greater extent will affect the overall operation of the indicator, so it should be changed any parameter with this in mind.
- TimeFame - parameter responsible for choosing a timeframe. By default, it has the Current time frame value, that is, the timeframe that is currently used on the chart.
- HMA Period - period of the moving HMA used by the indicator. The default value is 34.
- HMA Price - The price applied by the HMA calculations. The default value is 0, which is the opening price.
- HMA Speed - calculation speed of the HMA indicator. The default value is 2.0.
- Lines Visible - parameter responsible for the presence of a moving average on the chart. By default, it is set to true.
- Lines Number - the number of lines used in indicator calculations. The default value is 5.
- Color Up - the color of the indicator that will be responsible for the growth of the market. The default value is Blue.
- Color Down - parameter responsible for the color of the market fall. The default value is Red.
- Unique ID - the unique ID of the indicator. The default value is Hull Lines 1.
- alertsOn - parameter responsible for turning on notifications after the indicator receives a signal. The default value is false.
- alerts On Current - parameter responsible for playing the signal on the current candle. The default value is true.
- alerts Message - parameter that sends a message when a signal is received. The default value is false.
- alerts Sound - parameter responsible for playing a sound notification when a signal is received. The default value is false.
- alerts Email - parameter responsible for sending alert notifications to email when set to true. The default value is false.
- Show Arrows is a parameter responsible for displaying arrows on the chart. The default value is true.
- Arrow Size - indicator arrow size parameter. The default value is 2.
- Up Arrow Code - the code for rendering the arrow with the growth value. The default value is 233.
- Dn Arrow Code - Arrow code value with falling value. Default value is 234.
- Arrows On First bar - parameter responsible for the appearance of an arrow on the first bar. The default value is true.
Indicator signals
The HMA Arrows indicator with standard settings is displayed on the chart in the form of a moving average, which changes its color and direction when a trend is determined, as well as arrows that are formed when the conditions of the moving average change. That is, after a change in the direction of the trend, an arrow appears above or below the candles, and already then a sell or buy signal is formed. If it is canceled the presence of arrows on the chart, it can be focused on the indicator line, and vice versa, if it is canceled the presence of the line, it can be simply open a position depending on the arrow.
Signal for Buy trades:
- The moving average of the indicator is heading up and has a color with a growth value. This indicates an uptrend in the market.
- After the line acquires the color with the growth value, an upward arrow is formed under the candles.
When an arrow forms under a certain candlestick, which is due to an uptrend in the market, a signal to buy is formed and a long position can be opened. It should be closed when the opposite conditions are received, namely, when the color and direction of the moving average change and a new arrow appears on the chart. In this case it is possible to open a new position in the opposite direction.
Signal for Sell trades:
- The moving HMA, turning into the color with the fall value, went down.
- On the candle, on which the color of the line changed, an arrow is formed, pointing down.
After receiving such conditions, a signal is formed on a certain candle, after which a short position can be opened. It should be closed if the indicator gives a reverse signal, that is, if the moving average changes color and direction and another candle appears on the chart. Thus, the downtrend in the market is replaced by an uptrend and should consider opening new trades.
Conclusion
The HMA Arrows indicator can be called universal for the ability to select any currency pair and timeframe, trade with maximum profit, as well as the presence of signal alerts generated under certain market conditions. The indicator also has fairly advanced settings in the settings, which allows fully adapting the indicator to own trading system. In order to learn how to correctly apply the indicator in practice, it is recommended to use a demo account first, as well as correct money management.

