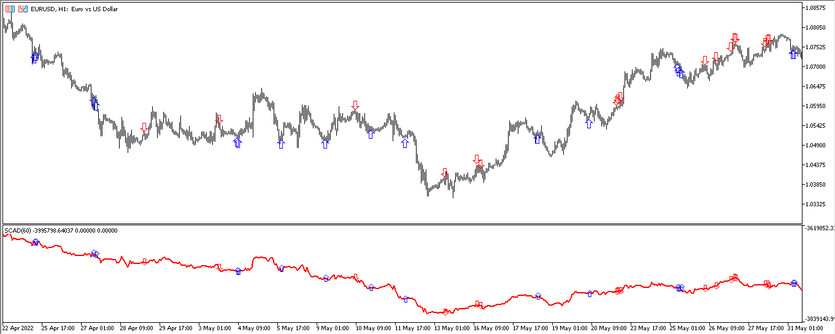
The iCross AD uses rather complex calculations that are performed by several indicators, the main of which is CCI. Using its calculations, the indicator identifies the optimal entry and exit points from the market, marking them with arrows of a certain color and direction. Arrows appear above or below the line, which is located in the lower window of the price chart, and then transferred to the main one.
The indicator's signals are accurate, as they are filtered, which can be turned on or off in the indicator settings. But it should be borne in mind that if filtering is disabled, then there will be more signals, but many of them will be false, and if filtering is enabled, then there will be fewer signals, but the possibility of false signals will be practically eliminated. The iCross AD indicator can be used with any currency pairs, on any convenient timeframe.
Input parameters
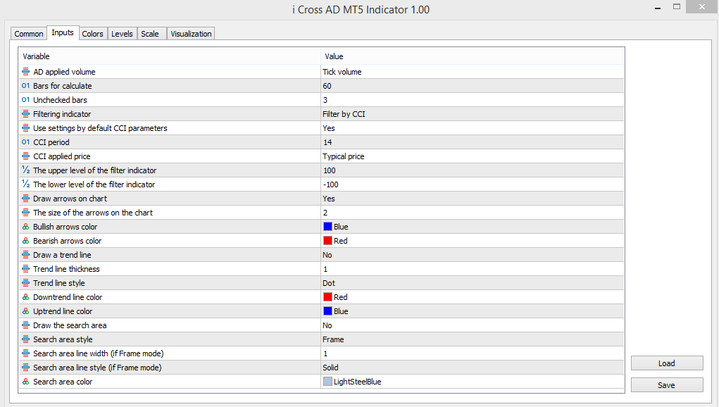
Due to the large amount of work performed, in its settings, the ICross AD indicator has more than twenty input parameters that are responsible both for the technical work and for the visualization of the indicator itself.
- AD applied volume - volume that is used in indicator calculations. By default, it has the Tick volume value.
- Bars for calculate - the number of bars to which the indicator's calculations will be applied. The default value is 60.
- Unchecked bars - bars not checked by the indicator. The default value is 3.
- Filtering indicator - parameter responsible for filtering incoming signals. The default value is Filter by CCI.
- Use settings by default CCI parameters - parameter responsible for setting all default CCI parameters. The default value is Yes.
- CCI Period - CCI indicator period. The default value is 14.
- CCI applied price - the price to which the calculations of the CCI indicator will be applied. The default value is Typical Price.
- The upper level of the filter indicator - the value of the upper level of the indicator that will cross its CCI line. The default value is 100.
- The lower level of the filter indicator - parameter responsible for the lower level of the indicator crossed by its line. The default value is -100.
- Draw arrows on chart - parameter responsible for transferring arrows from the indicator window to the main chart. The default value is Yes.
- The size of the arrows on the chart - the size of the arrows that will be displayed on the main chart. The default value is 2.
- Bullish arrows color - parameter responsible for the color of arrows with growth value. The default is Blue.
- Bearish arrows color - color of arrows with fall value. The default value is Red.
- Draw a trend line - parameter responsible for the presence of a trend line on the chart. The default value is No.
- Trend line thickness - the thickness of the trend line of the indicator. The default value is 1.
- Trend line style - type of trend line. The default value is Dot.
- Downtrend line color - the color responsible for the downtrend. The default value is Red.
- Uptrend line color - uptrend color. The default is Blue.
- Draw the search area - parameter corresponding to the search area. The default value is No.
- Search area style - the view in which the search area is performed. The default value is Frame.
- Search area line width (if Frame mode) - search area line width. Default value is 1.
- Search area line style (if Frame mode) - search line type. Default is Solid.
- Search area color - search line color. The default value is LightSteelBlue.
Despite the fact that the main parameters of the indicator already contain parameters that are responsible for the color and thickness of the indicator values, they can also be changed in the Colors section of the indicator, and additional levels can also be added in the Levels section.

Indicator signals
The iCross AD indicator is presented as an arrow indicator, and therefore, according to the principle of all arrow indicators, iCross AD generates a signal when an arrow forms in one direction or another on the chart under certain conditions. In this case, one should take into account the direction of the indicator line and its intersection with the negative zone and positive.
Signal for Buy trades:
- In the indicator window or on the chart, an arrow with the growth value has formed, that is, directed upwards.
- At the same time, the line in the indicator window should move up, indicating an uptrend.
When such an arrow is formed, taking into account the values of the line, a long position can be opened. It should be closed after a new arrow appears on the chart, which makes it possible to open a new trade.
Signal for Sell trades:
- An arrow with a drop value is formed on the chart. It should go from top to bottom.
- The line in the indicator window should be directed downwards. This will indicate the presence of a downward trend.
After the formation of an arrow with a fall value, as well as a line in this direction, a short position can be opened. It should be closed after a new arrow appears on the chart, this may be a signal to open a new position.
Conclusion
The iCross AD trading indicator is very effective when used correctly, as it is based on the standard CCI indicator, which shows good results in practice. Also, thanks to careful filtering, the iCross AD signals are very accurate. But in order to be able to use the indicator correctly in practice, it is recommended to use a demo account beforehand, which will allow not only to study the indicator, but also to instill good trading skills.


