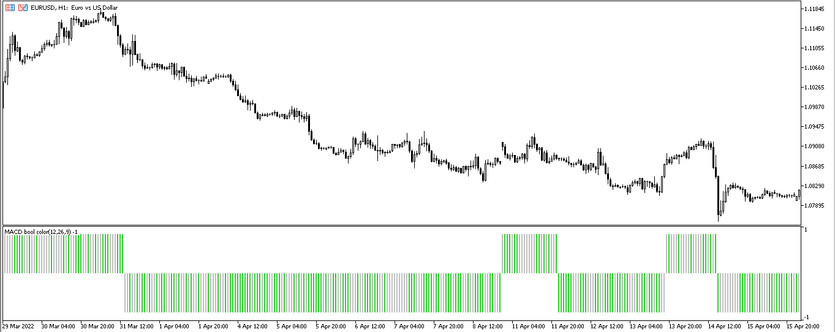
MACD Bool Color is a modified version of the MACD oscillator. The MACD Bool Color indicator is presented in the form of a histogram that is easier to understand, thanks to which visual signals are created that allow opening a trade in any direction. This scheme of work is simplified, so the indicator can be used even by beginners. It can be called universal, as it works quite accurately on any timeframe, with any currency pairs.
Input parameters
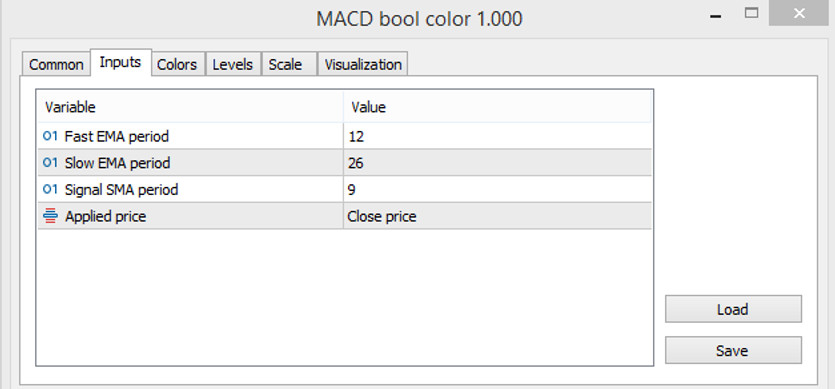
The MACD Bool Color indicator has absolutely identical parameters in the settings with its previous version. Despite the similarity of the parameters of these indicators, the MACD Bool Color signals are more accurate.
- -Fast EMA period-value of the fast exponential moving average period. The default value is 12.
- -Sow EMA period - the period of the slow exponential moving average. The default value is 26.
- -Signal EMA period-period of the signal line of the indicator. The default value is 9.
- -Applied price - the price to which the general calculations of the indicator will be applied. The default value is Close price.
Since the MACD Bool Color histogram is painted in two colors, in the indicator settings it is possible to change them, change its width, as well as add additional levels that the histogram will cross.

Indicator signals
The MACD Bool Color indicator gives accurate signals to enter the market, despite this, using the indicator will not make much effort, especially if it is carefully studied the strategy of both versions before using it. The histogram periodically changes its color and direction, and a change in one of these conditions will be a signal indicator.
Signal for Buy trades:
- -In the indicator window, columns are formed with a color indicating growth.
- -Then the bars start growing upward, above level 0.
After the columns move to the zone above level 0, a long position can be opened. Such trade should be closed in two cases: if the columns change color or direction.
Signal for Sell trades:
- -The histogram of the indicator is colored with the fall value.
- -Histogram bars change positions and move level 0 down.
After the bars cross the level from top to bottom, a short position may open, which should be closed after changing the color or direction of the histogram.
Conclusion
To achieve the desired success from the transaction, it is recommended not only to study the MACD Bool Color on a demo account, but also to use it with additional tools that confirm the accuracy of the indicator signals. With the correct use of this indicator, it can be achieved real success from any trade.


