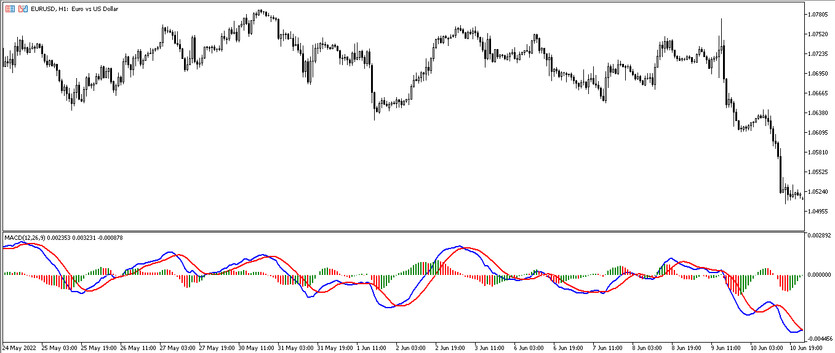
The MACD Histogram MC is an updated and thus improved version of the standard MACD indicator, which can be used in trading for the same purposes as the MACD itself, that is, to determine the current trend, its strength and find the best moment to enter the current market, however the new version prevails with greater accuracy in calculations and generated signals. MACD Histogram MC is displayed in the lower window of the price chart as a multi-colored histogram with two signal moving lines, which, depending on market conditions, is located above or below the signal level 0. Thanks to these indicator values, it can be easily and quickly, and most importantly, effectively made any trades.
The MACD Histogram MC indicator can be used in trading with any currency pairs, on any convenient timeframe.
Input parameters
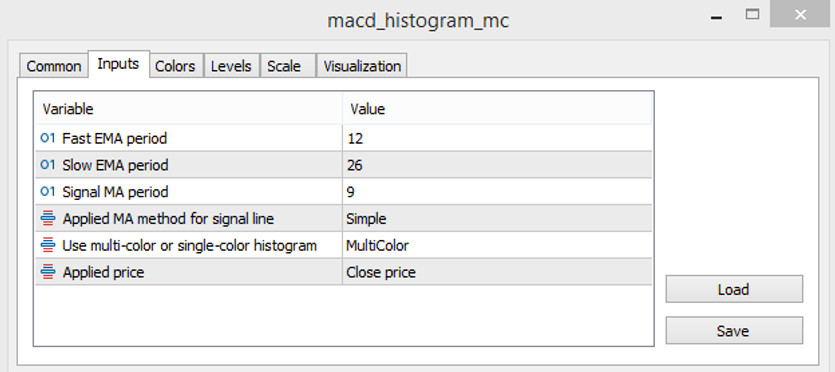
The input parameters in the settings of the MACD Histogram MC indicator do not differ much from the parameters of the standard version. Only a few new parameters have been added, which allows more carefully adapting the indicator to own trading strategy. Its settings also have special sections that are responsible for the color scheme and thickness of the indicator values, as well as adding signal levels to its window.
- Fast EMA Period - fast exponential moving average period of the indicator. The default value is 12.
- Slow EMA Period - the value of the period of the slow exponential moving average of the indicator. The default value is 26.
- Signal MA Period - period of the signal line of the indicator. The default value is 9.
- Applied MA method for signal line - parameter responsible for choosing the type of moving average smoothing that will be used by the indicator. The default value is Simple.
- Use multi-color or single-color histogram - parameter responsible for coloring the histogram in several colors. The default value is Multi Color.
- Applied Price - indicator parameter responsible for the type of price to which its calculations will be applied. The default value is Close Price.

Indicator signals
The signals of the MACD Histogram MC indicator are absolutely identical to the signals of its standard version, so using the indicator in practice should not be difficult. The main thing before opening a certain trade is to determine the color of the histogram, its location relative to level 0, the intersection and location of the signal lines relative to each other. And only then, if the conditions based on these indicator values match on a certain candle, a position can be opened in the direction with the current trend.
Signal for Buy trades:
- At least three bars of the histogram are located above level 0 and have a color with a growth value.
- The signal lines of the indicator cross so that the fast moving average is above the slow one, while both lines are also above 0.
After receiving such conditions, a long position can be opened on a certain candle. It should be closed after receiving the opposite conditions, namely, a change in the color or direction of the indicator histogram, as this will signal the end or weakening of the current uptrend.
Signal for Sell trades:
- The indicator's histogram has fallen below its level 0 and at least three of its bars are colored with a falling value.
- The signal lines of the indicator also fall below level 0, but at the same time the slow signal line is higher than the fast one.
Upon receipt of such conditions from the indicator, a short position may be opened. It should be closed after the histogram changes its location relative to level 0 or turns into a different color. In this case, the downtrend weakens or ends and is replaced by a new one.
Conclusion
The MACD Histogram MC indicator is very easy to use, but at the same time very effective, and is not inferior in accuracy to its own kind of indicators. The indicator shows good results only when used correctly, so it is recommended to use a demo account before using the indicator.


