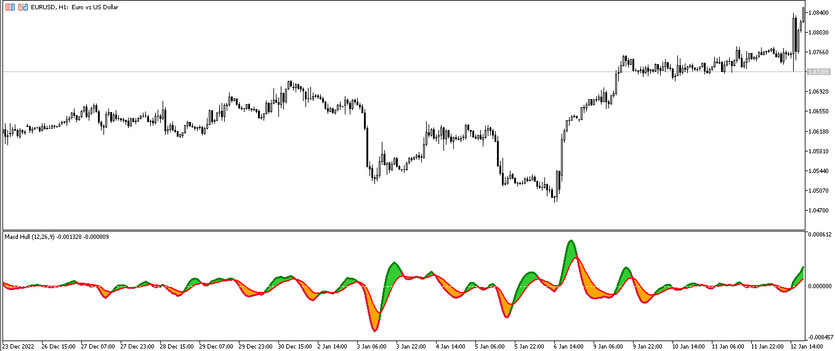
The MACD Hull trading indicator is an algorithm created on the basis of the interaction of two effective indicators. The resulting algorithm of their functioning can be used for trading, namely, to determine the current trend and its strength, as well as to open trades during this period. It is presented in the lower window of the price graphics in the form of two lines, the main one, which changes color when determining the direction of the current trend, and the signal one, which, in turn, intersects with the main one, while the distance between them is colored in the color characterizing the current trend. Both lines move in a certain direction relative to the signal level. Thus, when trading, it is necessary to take into account all the factors of the indicator.
The MACD Hull indicator is suitable for use on any timeframe, with any currency pairs.
Input parameters
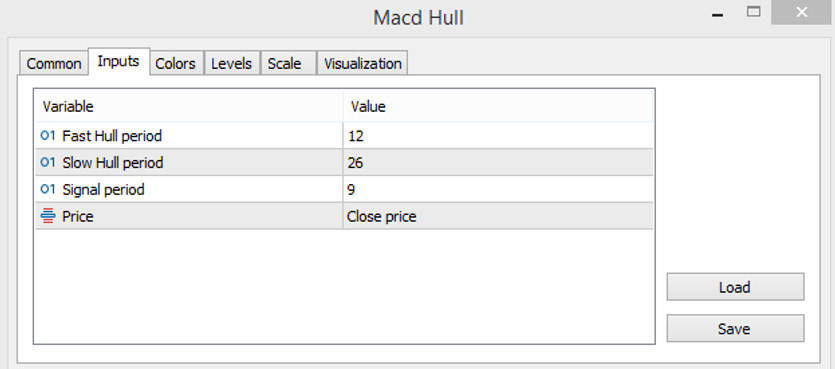
The settings of the MACD Hull indicator are almost the same as the settings of the standard MACD, while some of the input parameters are used to change the values of the included Hull MA indicator. The Colors section in its settings is used to change the color scheme and thickness of values, and the Levels section additional signal levels window.
- Fast Hull period - period of the fast moving average of the Hull MA indicator. The default value is 12.
- Slow Hull period - slow Hull MA period value. The default value is 26.
- Signal period - period of the signal line of the indicator. The default value is 9.
- Price - type of the price to which the indicator calculations are applied. By default, it has the Close price value.

Indicator signals
The algorithm for applying the MACD Hull indicator in practice is very simple. To open a certain trade using the indicator, it should be determined the current trend and its strength. To do this, it should be pay attention to the direction of the lines, their location relative to the signal level 0, the color of the main line, and the color of the distance between them. And thus, if an uptrend is determined, buy trades are opened, and if the trend is down, sell trades. In both cases, trades should be closed after the current trend changes.
Signal for Buy trades:
- The indicator lines intersect so that the main line, colored with a growth value, is higher than the signal one. The distance between them is colored with a growth value. And both lines are above the 0 level.
Upon receipt of such conditions on a signal candle, a buy trade can be opened, due to the presence of a strong uptrend in the market. Such a trade should be closed upon receipt of the opposite conditions, namely, at the next intersection of the lines and when the main color changes. At this moment, it can be considered the opening new trades due to a change in the current trend.
Signal for Sell trades:
- The indicator lines are moving down, falling below level 0. At the same time, the signal line is above the main one, which has a color with a falling value. The distance between the lines is colored with a growth value.
A sell trade can be opened immediately upon receipt of such conditions on a signal candle. At this moment, a strong downtrend is determined in the market. Such a trade should be closed when the market movement changes, namely when the lines cross and when the main color changes. At this moment, it becomes possible to consider opening new trades.
Conclusion
Despite its high efficiency, the MACD Hull indicator is very simple and easy to use, which makes it possible for traders with different levels of experience to use it. However, despite this, it is recommended to use the indicator on a demo account first to strengthen trading skills and its correct application.
You may also be interested The Recursive CCI Trading Indicator for MT5


