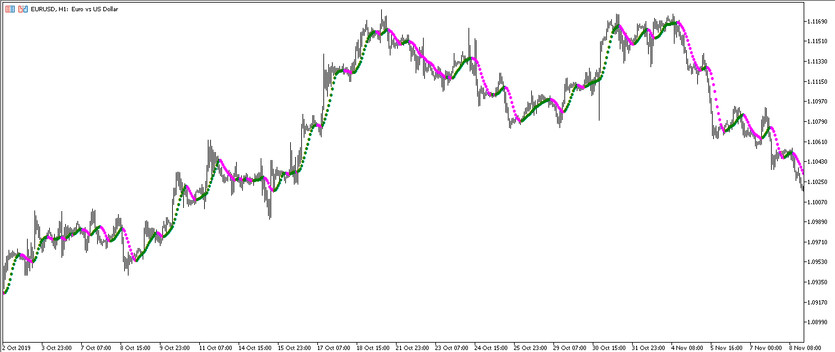
The Non-Lag Dot is a developed indicator that is used for trend trading. Due to the use of a moving average in its calculations, the Non-Lag Dot indicator very accurately determines the current market trend, during which certain trades can be opened. The indicator is displayed directly on the price chart in the form of dots of two colors that create one line. The direction of the indicator line created by means of dots and, accordingly, its color is the main indicator of the current market movement and the trade that should be opened at that moment.
The indicator can be used on any convenient timeframe, with any currency pair, as it is equally effective for any given units.
Input parameters
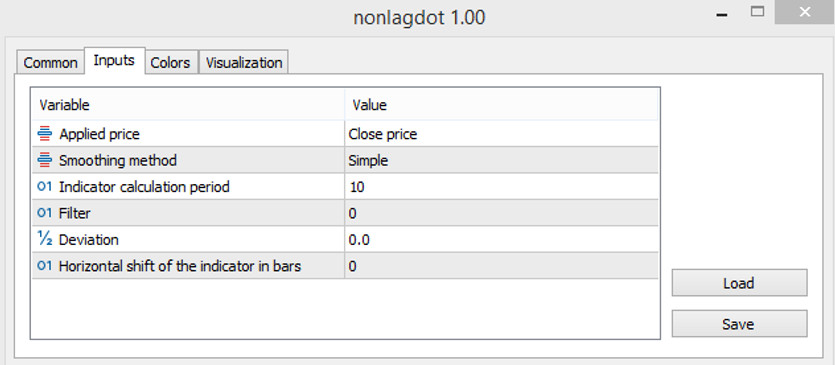
The indicator settings consist of six input parameters, the setting of which affects its overall operation. The indicator settings also have a Colors section, which does not affect its technical work, but affects its visualization, namely the color scheme and the thickness of the values.
- Applied price - the price to which the indicator's calculations are applied. The default is Close price.
- Smoothing method - the type of smoothing used by the moving average of the indicator. The default value is Simple.
- Indicator calculation period - calculation period used by the indicator. The default value is 10.
- Filter - value for filtering indicator calculations. The default value is 0.
- Deviation - deviation of the standard values of the indicator. The default value is 0.0.
- Horizontal shift of the indicator in bars - horizontal shift of the indicator in bars. The default value is 0.

Indicator signals
The Non-Lag Dot indicator is represented on the chart as a line consisting of dots of two colors. Thus, the color of these dots and their general direction is the main determinant of the current market trend. After determining the prevailing trend in the current market, a trade is opened in its direction. If the trend is up, buy trades are opened, if there is a downtrend, then sell trades.
Signal for Buy trades:
- At least three dots of the indicator are colored with the growth value, and the line formed by them moves up.
- Bars should be located above this line.
After receiving such conditions, a buy trade can be opened on the signal candle. It should be closed after dots of a different color begin to form on the chart, which will indicate a weakening or end of the current uptrend. It will also help to consider opening new positions due to the formation of a new trend.
Signal for Sell trades:
- The indicator line, created from its color dots with falling value, moves down.
- All current candles must be below the line.
Upon receipt of such a signal on a certain candle, a short position may be opened due to the presence of a downtrend in the market. Such a position should be closed immediately after the appearance of dots of a different color. This will indicate a change in the current trend, which will allow considering the opening of new trades.
Conclusion
The Non-Lag Dot is a very effective and smart trading algorithm that allows opening positions during a certain trend. The indicator is based on the principle of the standard moving average, so it should not cause difficulties in use, however, for better performance, practice on a demo account is recommended.
You may also be interested The PWMA Trend Envelopes Histo trading indicator for MT5


