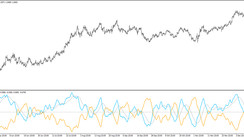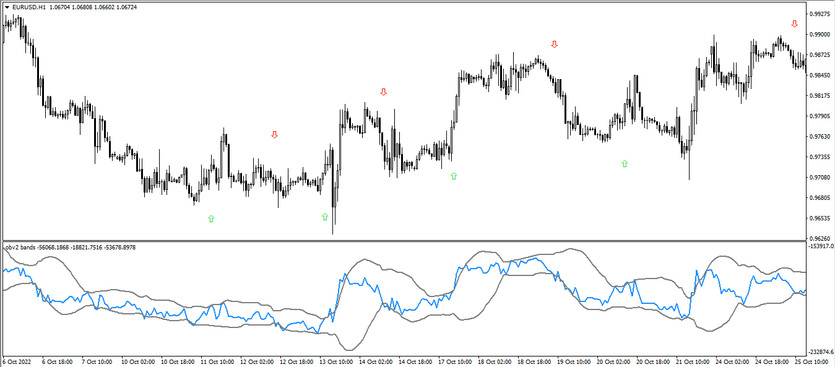
OBV 2 Bands Arrows is a developed trading algorithm that uses the current market direction to open certain positions. The concept of the indicator is similar to Bollinger Bands, while the indicator itself is presented in the lower window of the price chart in the form of a channel consisting of upper and lower boundaries and the main line. In addition to the lines, the indicator also draws arrows of a certain color and direction on the price chart, which indicate a signal candle. The indicator’s calculations are based on the volumes of the current market, while opening certain trades, the current trend is also taken into account.
The OBV 2 Bands Arrows indicator is suitable for trading on any timeframe using any currency pair.
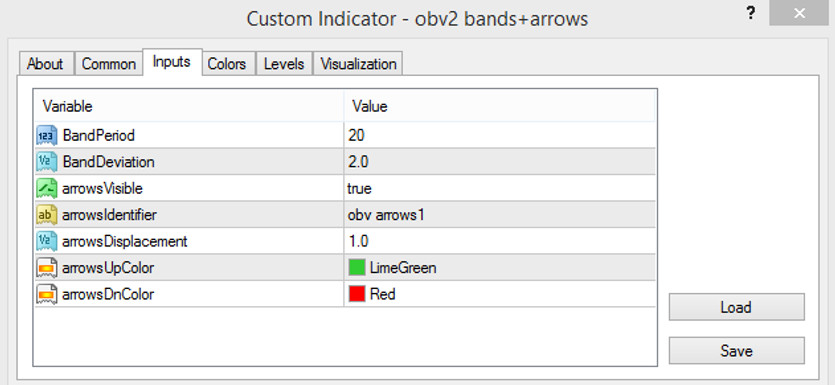
Input parameters
The indicator settings consist of several sections. The Input Parameters section is more responsible for the overall technical operation of the indicator, while the Colors section affects its visualization: the color and thickness of the values. The Levels section is used to add signal levels to the indicator window.
- Band Period - the period of the indicator lines. The default value is 20.
- Band Deviation - deviation of the current values of the indicator lines from the standard ones. The default value is 2.0.
- arrows Visible - parameter responsible for the presence of arrows in the price chart. The default value is true.
- arrows Identifier - indicator responsible for arrows calculations. The default value is obv arrows 1.
- arrows Displayment - parameter responsible for the distance of the arrows from the price chart candles. The default value is 1.0
- arrowsUpColor - Arrow color parameter with growth value. Default is LimeGreen.
- arrowsDnColor - color parameter of the arrow responsible for short positions. The default value is Red.
Indicator signals
Using the OBV 2 Bands Arrows indicator is very simple. To open a certain trade, it is enough just to take into account the color and direction of the arrow formed on the chart. In this case, the arrows are formed at the moment when the middle line of the indicator crosses one of the channel boundaries. In this case, all trades must also be confirmed current market trend. If the current trend is upward, long positions are opened, if the trend is downward, positions are short. When receiving a reverse signal from the indicator or when the trend direction changes, trades should be closed.
Signal for Buy trades:
- The indicator lines are moving up, while the middle line crosses the upper border of the channel.
- Under a certain candle, an arrow is formed that has a color with a value of growth and is directed upwards.
Upon receipt of such conditions, a buy trade can be opened on the candlestick, which is confirmed by the arrow. At this moment, the market is in an uptrend. The trade should be closed at the moment the current trend direction changes, or when the reverse conditions are received from the indicator, for example, when another arrow appears. At this point, it should be considered opening new trades.
Signal for Sell trades:
- All three lines of the indicator are directed from top to bottom, while the middle line crosses the lower border of the channel.
- An arrow with a drop value is formed on the chart.
When a full combination of conditions is received on a signal candle, a sell trade can be opened, with a downtrend in the market. Such a trade should be closed when the current trend changes or when the opposite conditions are received from the indicator. At this moment, it should be prepared to open new trades.
Conclusion
OBV 2 Bands Arrows is a very accurate and efficient trading algorithm that calculates taking into account the current market volumes. At the same time, the indicator is very easy to use thanks to convenient and understandable visualization, which makes it possible for traders with different levels of training to use it. Trading skills and algorithm of using the indicator can be strengthened by preliminary practice on a demo account.
You may also be interested Three Line Break Chart trend trading indicator for MT4