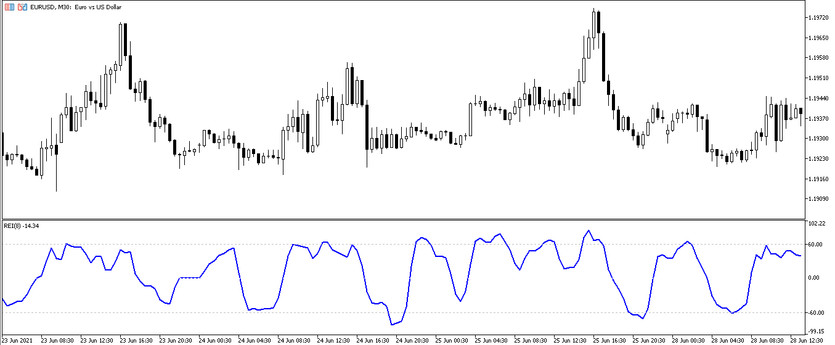
The relative oscillator indicator, the Range Expansion Index, is designed to identify oversold and overbought conditions. If the price shows weakness or strength, the indicator gives a signal of overbought or oversold, after a change in the rate of price change, if the price shows weakness or strength. It is a line that is located in the lower window of the price chart and has a value from -100 to +100.
The indicator works both with a strong trend and with a sideways movement in the market, however, it is advisable to trade when a trend is detected, as it increases the possibility of making a profit. Trades can be made on any timeframe, with any currency pairs. However, it is still recommended to choose low timeframes, to get more accurate and efficient signals.
Input parameters
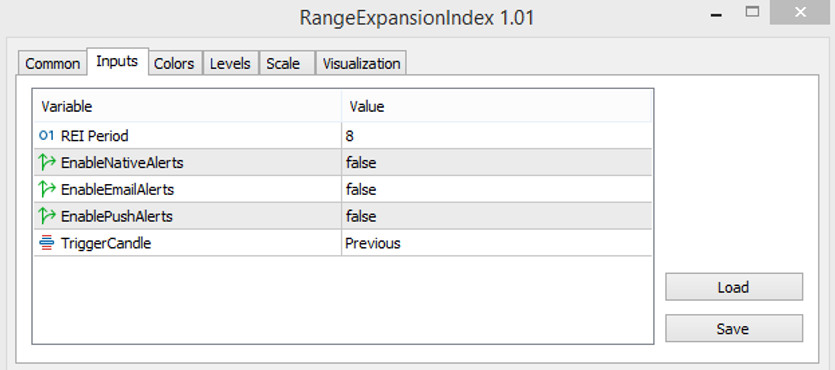
The Range Expansion Index indicator has 5 input parameters. Each of them affects its operation to some extent. The best solution would be to leave the indicator parameters unchanged. But at the same time, the value of the notification parameters should be changed for your own convenience.
- -REI Period - indicator calculation period. The larger the period value, the fewer signals are generated, but the more accurate they are. If the value is less, then vice versa, more signals are generated, but their accuracy will decrease. The default value is 8.
- -EnableNativeAlerts - notification that comes to the main chart window when the line crosses the -60 or 60 level indicator, if True is selected. The default value is False.
- -EnableEmailsAlerts - notification sent to the previously specified e-mail when the line crosses the level indicator -60 or 60, if True is selected. The default value is False.
- -EnablePushAlerts - notification that comes to the previously specified mobile device in the form of a push notification when the line crosses the -60 or 60 level indicator, if True is selected. The default value is False.
- -TriggerCandle - Notification check candle. Default value is Previous. Previous - the most recent closed candle, Current - the current and not yet closed candle.
Also in the indicator settings,it can be changed the color and width of the moving average, as well as add additional levels, at the intersection of which, the indicator will send a signal.
Indicator signals
The indicator line will fluctuate within the range from -100 to 100, the optimal value of the levels can be selected in the indicator parameters. By default, the levels in the parameters are set in the range from -60 to 60. And the intersection of the indicator line with one of the specified levels will be its signal. Accordingly , if the line crosses one of the indicated levels and is above or below it, then this will indicate oversold or overbought.
Signals for Buy trades
- -The price moves up and crosses the positive level from the bottom up, and is in the overbought zone. After that, the price falls below the overbought level and is below it.
The trade should be closed if:
- - The price has crossed the overbought zone and stays in it for an indefinite time.
- -The price goes down and approaches the oversold zone.
Signals for Sell trades
- -The indicator line goes down, below the oversold level. Then, the price rises above this level again.
It is needed to close a short position if:
- -The indicator line has crossed the oversold level and is in this zone in the near future.
- -The price is heading up to the overbought zone.
Conclusion
The Range Expansion Index indicator is great for trading on small time frames. It accurately indicates overbought and oversold conditions and identifies trade entry points. However, its signals can also turn out to be false, so it is should be used additional indicators and tools for its full functioning. It is also recommended use a demo account before trading on a real deposit.

