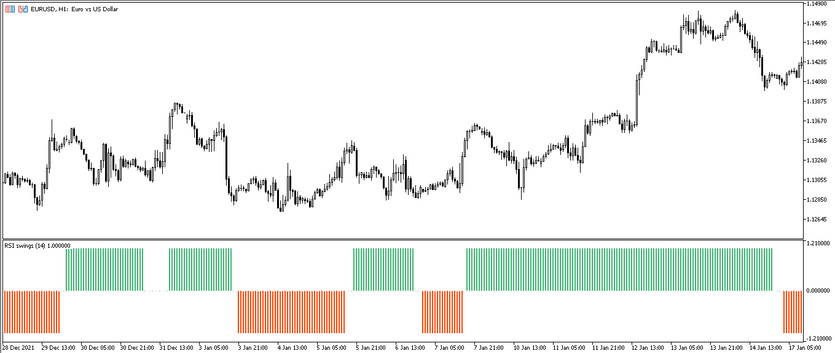
The RSI Swings indicator is a modification of the standard RSI indicator. This algorithm is used to trade with the trend, that is, a trade is opened in the direction of the current market trend, which in turn is determined by the indicator. The RSI swings is used to determine the current trend and find the best points for opening positions in this period. The indicator is presented in the lower window of the price chart in the form of a histogram composed of columns that have a certain color and are located above or below the signal level. Thus, to determine the current market movement, it will be necessary to take into account these indicator values, which are the main indicators of information market.
The RSI Swings indicator can be used when trading on any timeframe, with any currency pairs, as it is equally effective when choosing any values.
Input parameters
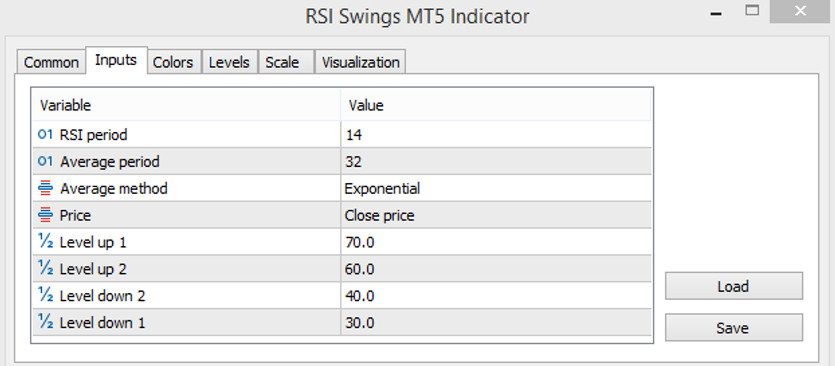
There are several sections in the settings of the RSI swings indicator, each of which directly affects the specific operation of the indicator. The input parameters consist of 8 points, each of which should be changed taking into account the trading parameters. The Colors section is used to change the color scheme of the indicator, and the Levels section is used to add additional signal levels to its window, in addition to the already added signal levels.
- RSI period - period of the RSI indicator. The default value is 14.
- Average period - period for smoothing the indicator values. The default value is 32.
- Average method - type of smoothing of the moving average used by the indicator. The default value is Exponential.
- Price - price to which the indicator's calculations are applied. By default, it is set to Close price.
- Level up 1 - the value of the first upper level of the indicator. The default value is 70.
- Level up 2 - the second upper level of the indicator. The default value is 60.
- Level down 1 - value of the first lower signal level. The default value is 40.
- Level down 2 - the second lower signal level of the indicator. The default value is 30.

Indicator signals
The algorithm for applying the RSI swings indicator in practice is very simple and very easy to master. Its concept of use is the same as that of all histogram indicators. That is, if the histogram bars have a color with a growth value and rise above the 0 level, then the trend is up, and long positions are opened, and if vice versa, the histogram bars, colored in color with a falling value, fall below the 0-trend downtrend level and short positions are opened position. That is, the direction of the trade depends on the current trend. If there is no trend in the market, that is, the indicator columns do not appear for some time, any trades are temporarily not opened.
Signal for Buy trades:
- The histogram of the indicator rises above the signal level 0 and has a color with a growth value.
Upon receipt of such a condition, a long position may immediately be opened on the signal candle, due to the presence of an upward trend. Such a trade should be closed after the histogram bars turn into a different color and move in the opposite direction relative to level 0. This will indicate a possible change in the current trend, which will allow to consider the opening of new positions.
Signal for Sell trades:
- Histogram bars that are color - coded with fall value fall below level 0.
Upon receipt of such conditions characterizing a downward market movement, a short position may be opened on the signal candle. It should be closed upon receipt of the opposite conditions from the indicator, namely, when the color and direction of the columns change. At this moment, one should consider opening new trades due to a change in the current trend.
Conclusion
The RSI swings indicator is a very convenient, but at the same time quite effective trading algorithm, the calculations of which accurately serve to identify the current trend and trade during its reign. The RSI swings indicator is very easy to use, but despite this, before trading on a real deposit, it is recommended to practice on a demo account.
You may also be interested The Bollinger Bands Squeeze trading indicator for MT5


