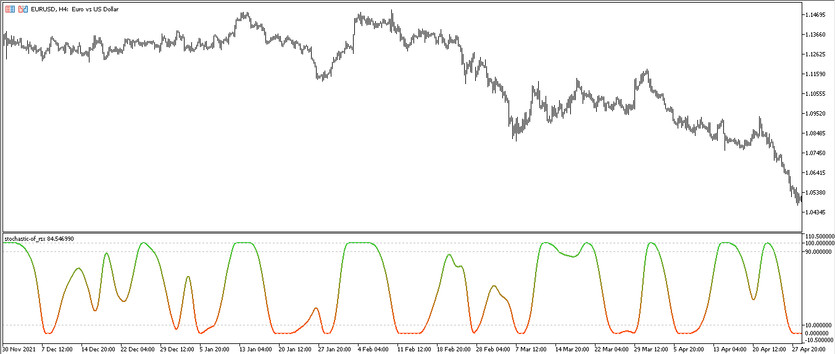
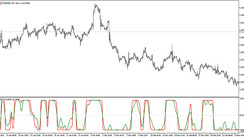
Stochastic of RSX is a small system based on the interaction of two effective indicators, one of which is included in the standard forex set. The purpose of the RSX indicator, which in turn consists of RSI and MA indicators, is to determine the current trend, as well as overbought or oversold zones, and the Stochastic indicator serves to determine the end of the trend market correction. But both indicators are united by the goal of finding the right moment to open positions. Thus, taking into account the calculations of its components, the Stochastic of RSX determines the current trend and finds the optimal moment to enter the market. The indicator is presented in in the lower window of the price chart in the form of a line that changes color depending on its location and direction.
The Stochastic of RSX indicator can be used on any timeframe with any currency pairs.
Input parameters
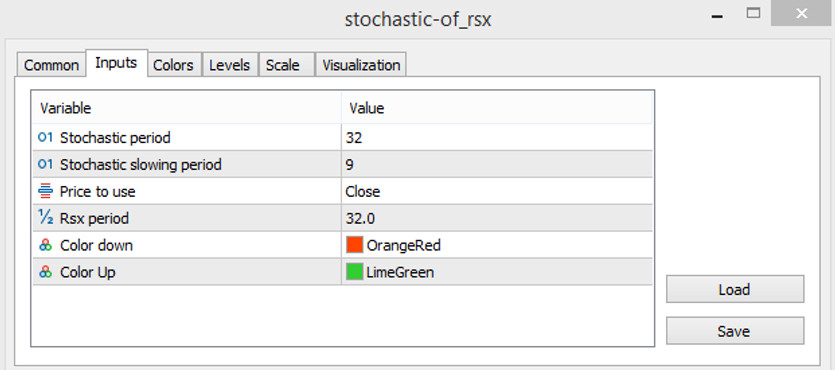
In the settings of the Stochastic of RSX indicator, there are six input parameters responsible for the operation and calculation of the indicator, however, some of them may be responsible for its visualization. The Colors section of the indicator affects the color and thickness of the indicator values, and the Levels section affects the addition of signal levels. By default, levels 10,90 and 100 have already been added to the indicator window.
- Stochastic Period - parameter responsible for the period of the Stochastic indicator. The default value is 32.
- Stochastic Slowing Period - the period of slowing down the indicator values. The default value is 9.
- Price to use - the price on which the indicator's calculations will be based. The default value is Close.
- RSX Period - the period of the RSX indicator. The default value is 32.0.
- Color Down - parameter responsible for the color with a down value. The default value is OrangeRed.
- Color Up - parameter that determines the color of growth in the market. The default value is LimeGreen.
Indicator signals
In using the Stochastic of RSX indicator in practice, everything is simple. The indicator is presented on the chart as a line, which, depending on market conditions, changes its color and direction, as well as its location relative to the levels of 10,90 and 100. Thus, in order to make any the position will need to take into account all these values. And if they match on a certain candle, a trade can be opened in the direction with the current trend.
Signal for Buy trades:
- The indicator line should rise from level 10 to level 100, and at the same time be painted in a light shade of color with a growth value.
After the line starts moving up and turns into a color with a growth value, a long position can be opened. It should be closed after the line changes its direction. This will indicate a weakening or end of an uptrend and a possible start of a downtrend, at which it can be opened new trades.
Signal for Sell trades:
- The indicator, colored in a lighter shade of color with a falling value, crosses its level of 100 and starts moving down to level 10.
After receiving such conditions on a certain candle, a short position can be opened. It should be closed after the indicator line changes its direction in the opposite direction. In this case, it should be prepared for a possible start of an upward movement, and thereby opening new trades.
Conclusion
The Stochastic of RSX indicator is very effective and easy to use, and due to this it can be useful for traders with different levels of preparedness. The indicator can be used in trading as the only one or with the addition of another indicators or special advisors. Thus its use with additional indicators and tools, as well as premature practice on a demo account, will increase the chance of getting maximum profit.

