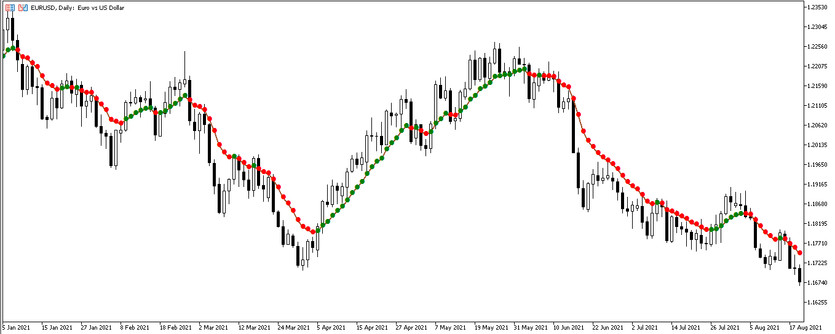
The Var Mov Avg indicator is designed to determine the current trend and calculate accurate signals based on it. This is a moving line formed by dots on the price chart. Even though the indicator is based on a moving line, it has a different calculation strategy. The way it is calculated is very different from other moving average indicators. It calculates a moving average with a sophisticated noise filter, so the indicator's signals are rarely false. It can be used with any currency pair on any timeframe.
Input parameters
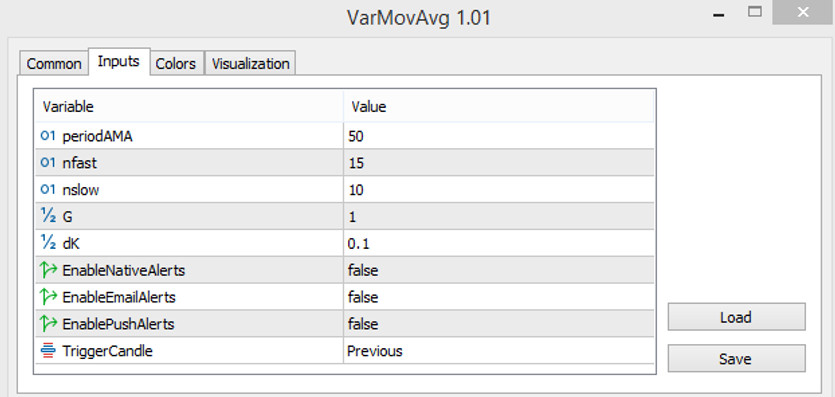
The Var Mov Avg indicator consists of a sufficient number of input parameters that help to fully adapt the indicator to itself. Also, the indicator can send a signal in any form convenient for the trader.
- -periodAMA-period of the main moving average. Accordingly, the higher this number, the less smooth the line will be. The default value is 50.
- -nfast - parameter of the first noise filter. The higher the value of this parameter, the less sensitive the indicator becomes to bursts. The default value is 15.
- -nslow - parameter of the second noise filter. The higher the value of this parameter, the less sensitive the indicator becomes to bursts. The default value is 10.
- -G-value of the degree of the moving average filter. And the higher its value, the smoother the indicator line. The default value is 1.
- -dK - indicator point distribution parameter. The default value is 0.1.
- -EnableNativeAlerts - a signal that, when set to true, sends a pop-up notification in the main window of the indicator when an optimal trade entry is formed. The default is false.
- -EnableEmailAlerts - a signal that, when set to true, sends a notification to the previously specified email when an optimal trade entry is formed. The default is false.
- -EnablePushAlerts - a signal that, when set to true, sends a notification to the previously specified mobile device when an optimal trade entry is formed. The default is false.
- -TriggerCandle - a candle for checking an alert. The default value is Previous . Previous is the last closed candle, and Current is the current, not yet finished candle.
As well as in the settings of other indicators, in Var Mov Avg it can be changed the colors and width of the indicator at the own discretion.

Indicator signals
The Var Mov Avg indicator, as mentioned earlier, consists of dots. The dots have three colors. And accordingly, changing the color of the dots of the indicator will be its main signal.
Signal for Buy trades
- -Indicator points have a growth value and characterize the appearance of an uptrend in the market. In this case, it should be opened a long position.
Close the trades if:
- -The dot changed color and acquired the value of falling, a downtrend has formed on the market.
- - A point has been formed indicating a sideways movement of the market. The point has neither growth nor fall.
Signal for Sell trades
- -Indicator points have a fall value characterize the appearance of a downtrend in the market. In this case, it should be opened a short position.
The trade must be closed when:
- - The dot changed color and acquired the value of growth, an uptrend has formed on the market.
- - A point has been formed indicating a sideways movement of the market. The point has neither growth nor fall.
Conclusion
The Var Mov Avg indicator is a universal and very interesting indicator in terms of how it works. Despite the fact that its calculation method is somewhat different from other similar indicators, its signals are accurate in almost all cases. It should be taken into account that the indicator does not give an exact guarantee for a profitable trade, therefore, in order to avoid losses, it is better to use additional tools and indicators.


