There are various time frames in FX, and while the hourly chart is particularly popular, there are the 5-minute and 1-minute bars as well.
The tick chart is the shortest chart type of them all and is not actually based on time. The tick chart only represents changes to price every time the price fluctuates (a tick occurs).
There is a lot of valuable information that can be learned from the movement of ticks. So, here in this article, we will introduce the “Tick_Counter” indicator for Metatrader 4 that will help you analyze these price ticks.
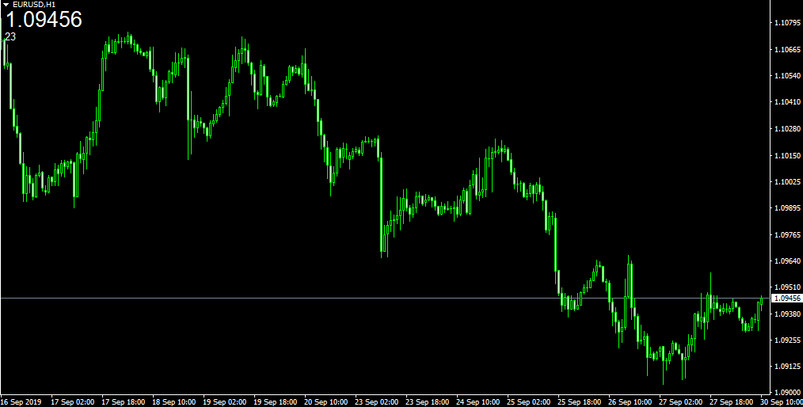
This indicator displays the price and tick counter in the upper right corner by default. The display location can be changed via the parameter settings.
The tick counter is unique to this indicator. The tick counter keeps track of the number of ticks that have occurred since the indicator was activated. For example, if the price has changed 30 times since the indicator started to count, then the tick counter will show 30.
Tips for using:
There are various ways to use the tick counter. As an example, you might want to use it to measure volatility. If the tick counter moves rapidly in a short time, it can be judged that the volatility is high. On the other hand, if the tick counter does not move for as long as 10 seconds, it can be considered that the volatility is low.
It is also recommended to check how much the tick counter has changed in one minute. For example, if the tick counter fluctuates more than 100 times per minute, the volatility can be considered to be high.
Compatibility: MT4
Parameters:
- Corner - Determines where the indicator is shown
- font_price - Color of price
- font_counter - Color of the counter
- size_price - Size of price
- size_counter - Size of Counter
Download the "Tick_Counter" MT4 indicator from the button below
Tip: Can’t open the downloaded archive file (ZIP or RAR)?
Try WinRAR for Windows or The Unarchiver for Mac .
Do you need help with installing this indicator into MT4 for Windows or Mac OS? Our guide HERE will help you.


