Ultimate oscillator, as its name suggests, belongs to the category of oscillators. This group of indicators differs in that to plot them; the current price is compared with the one that was several candles ago. All technical tools of this kind can be divided into relative, used to determine cyclical fluctuations and absolute, showing the difference in price.
The tools are easy to use and informative enough. However, they have one significant drawback. Their algorithm uses data from only one timeframe. As a result, the information turns out to be inaccurate, which can negatively affect trading.
Larry Williams decided to correct this deficiency. The oscillator proposed by him combines data from the time of three intervals. Average values are used to plot the indicator curve.
Ultimate MT4 Indicator. Williams' oscillator of multi-timeframe computational values.
Indicator calculations
The data calculation algorithm consists of three stages.
The first stage involves determining the true price low, designated as TL. To do this, choose the smallest value between the current low price and the previous close price.
TLn = min (Low_n, Close_n-1)
The next step is to define "buying pressure," referred to as BP.
BPn = Closen-TL_n
The second stage of calculations is devoted to determining the true TR range.
TRn = max ((High_n-Low_n), (High_n-Close_n-1), (Close_n-1-Low_n))
In the third step, the BP and TR values for the three time ranges are summed up, thereby obtaining the cumulative BPSUM and TRSUM ranges. They are used further to draw a curved line.
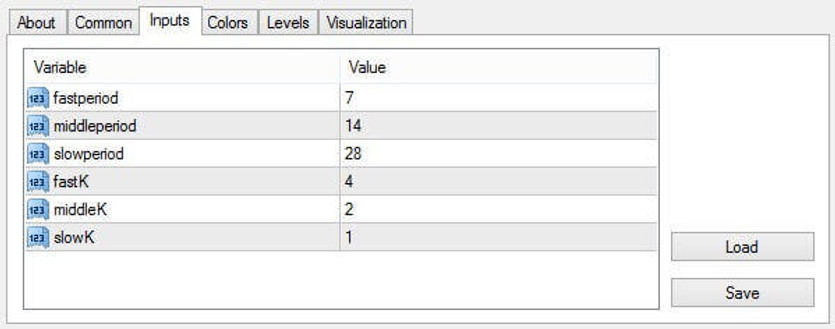
It is important to know that according to the formula proposed by Williams, the periods used for the calculation have an unequal effect on the final result. So, the younger period appears in the calculations three times, the middle one - twice, and the longest one - once. In order to correct the influence of periods, special weighting factors are used. They can be set manually. Usually, their values are taken equal to 1, 2, and 4 in accordance with a geometric progression.

Ultimate mt4 Indicator parameters
Indicator signals
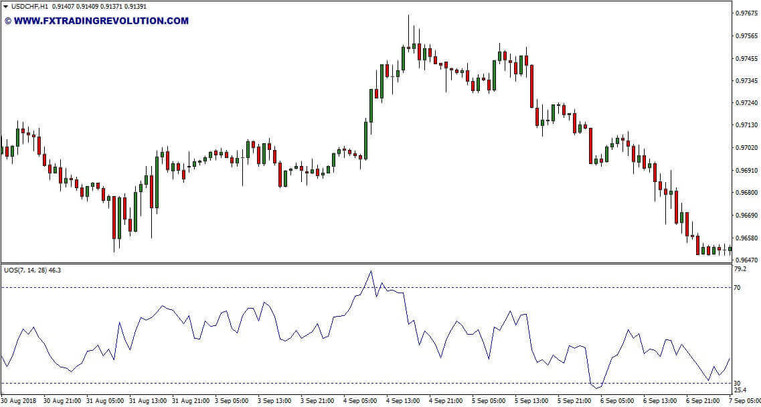
The Ultimate Oscillator is used for trading in the same way as traditional instruments of this kind. In particular, it can be used to determine the state of exit from the overbought and oversold zones in order to open positions in the desired direction in time.
If the oscillator curve breaks down the level, leaving the overbought zone, you should open a short position. When the line breaks the level upward when leaving the oversold zone, open a long position. This is the easiest way to use the ultimate oscillator.
The author himself recommends using divergence to enter the market, which is a divergence on the price chart and the indicator chart. It should be considered when divergence forms in overbought and oversold areas, which increases the chances of a successful trade. At the same time, before opening a deal in the desired direction, you need to make sure that the indicator curve has broken through an important level.
Conclusion
The oscillator proposed by Williams can be called one of the best indicators of this kind since it takes into account not only the readings of the current timeframe but also takes into account the higher ranges. As a result, false signals are eliminated, which often leads to losses.
Tip: Can’t open the downloaded archive file (ZIP or RAR)?
Try WinRAR for Windows or The Unarchiver for Mac .
Do you need help with installing this indicator into MT4 for Windows or Mac OS? Our guide HERE will help you.


