The Market Way indicator is a universal tool that is designed to determine the trend in the market and has several use cases. It works equally effectively both in small and large time periods. It is suitable for use on the chart of absolutely any financial instrument. This indicator is not included in the standard MT4 tool library. You can download and install it from the link below.
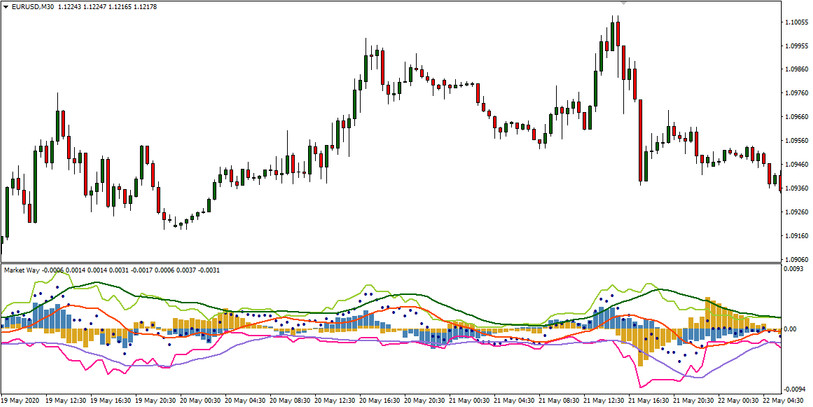
Despite the abundance of curve lines, to understand the program is easy enough. In the center of the information window of the indicator is a histogram, the columns of which are painted in blue and yellow. It is a smoothing parameter that is displayed in the settings.
The orange centerline is a trend indicator (traditional Moving Average). Two lines above it (green and light green colors) are indicators of an uptrend, and pink and purple curves identify a downward trend. Also on the chart are blue dots, the location of which relative to the mainline on the chart signals the entry into short or long positions.
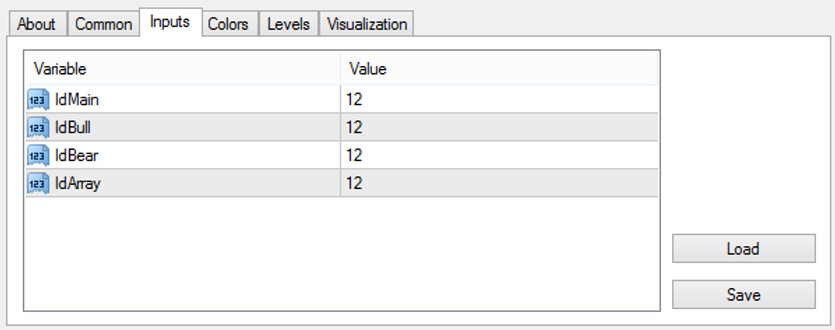
Indicator settings
Preset indicator settings assume the same value of 12 in all four columns. However, experiments are not excluded. You can set this parameter by any number multiple of 3 and 4 at the same time, but not more than 108 and not less than 12.
The IdMain parameter sets the value of the midline of orange (MA). The next element in the list, called IdBull, is responsible for displaying uptrend lines, which are colored in green and light green on the chart. The IdBear parameter is responsible for the visualization of the downward trend (purple and pink curves). IdArray - these are the parameters of the histogram presented on the chart.
Indicator signals
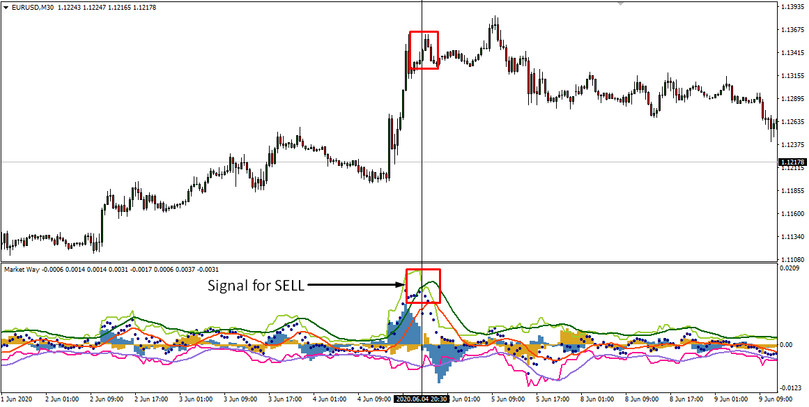
Using the Market Way indicator, you can conduct a comprehensive market analysis. For example, if the light green line along with the green line is too close to the upper edge of the indicator information window, then the market is overbought, and there is likely to be a price reduction in the near future. Confirmation of this is the intersection of green and light green lines from top to bottom. This means that the bears are now dominating the bulls. At this time, you can open short positions, though it's better to have a confirmation signal from some other source. An example of such a situation is shown in the screenshot.
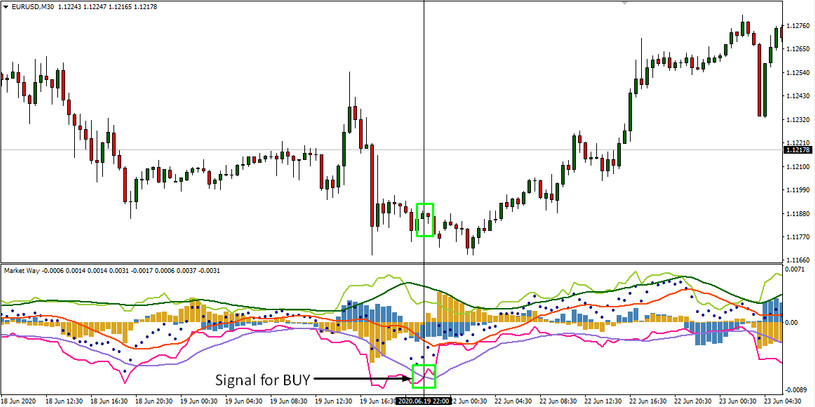
Similarly, we can consider the plexus of pink and purple lines below the zero mark. If they are located at the very edge of the Market Way indicator window, it means they will soon cross and exit the oversold zone. Therefore, we should expect growth, as in the example below.
There are several more ways to enter the market using indicator signals. The first is to observe the location of the blue dots relative to the centerline of orange. If they are above her, you can buy a pair. Entering sales is advisable if the blue dots are located below the mainline. If this signal coincides with the previous one, then its significance is significantly increased.
For the second method, a histogram and the centerline of the Market Way indicator are used. When the Moving Average is directed up, and the histogram columns move from the negative to the positive area, you can open transactions for the purchase of a financial instrument. In the opposite situation, when the histogram columns move from a zone above zero to a region below zero, and the central moving average is directed downward, short positions will be appropriate.
The third method is the most difficult. It provides for the coincidence of several signals. For a BUY, it is enough that the histogram columns are directed up above zero and are blue. For sales, the columns should look down and be yellow. You also need to wait for the intersection of green and light green lines up for long positions and pink and purple down for short ones. The direction of the order should be chosen in the direction of the centerline of the moving average - buy if it moves up, sell if it moves down.
Conclusion
Despite the fact that the indicator is a whole analytical system that allows you to effectively monitor trends in the Forex market, using it in the singular is still not recommended. It is advisable to include additional trend indicators in addition to the software product described above in the trading system. Signals will act as filters for each other and cut off false entrances to the market. You can also use Stochastic, MACD, RSI, Fractals.
Due to a large number of advantages, the indicator has become the subject of choice for many traders around the world. With its help, you can determine the phases of overbought and oversold and see the end and origin of the trend. It is easy to use and shows the minimum number of false signals.