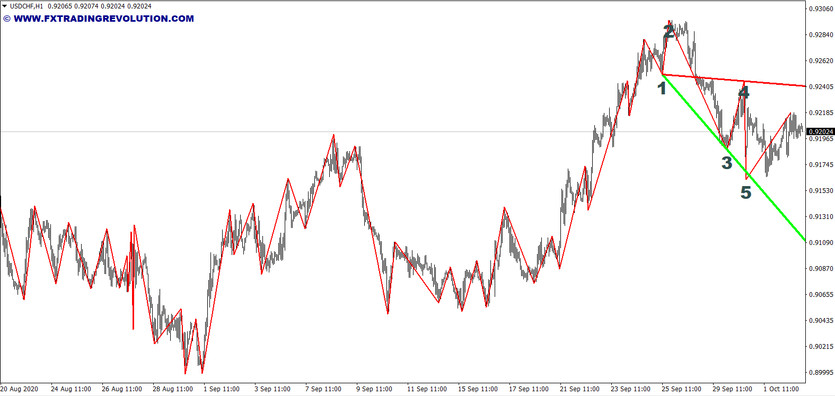
In technical analysis, Wolf Waves are a natural trading pattern found in almost any type and condition of the market. The pattern consists of five points, which reflect the desire of supply and demand to achieve an equilibrium state. The pattern can be formed both in the short-term and in the long-term - from minute timeframes to weekly. Wolf_Waves helps determine the current trend reversal moment, where the price will move, and after what time it will reach the designated place.
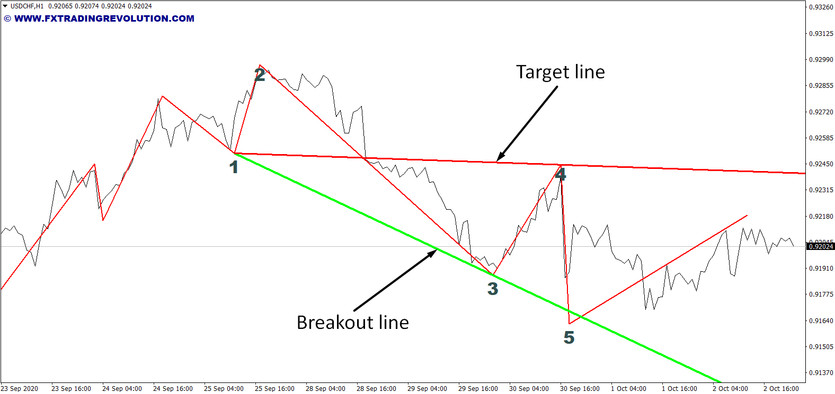
The Wolf Waves indicator is a fairly simple instrument in its principle. Wolfe waves are built in it according to the extrema of the Zig-Zag. The indicator starts building from the first top (or bottom), after working out the previous wave structures. Additionally, the tool marks the pattern's key points with numbers and draws two lines: a breakout line and a target line.
Indicator settings
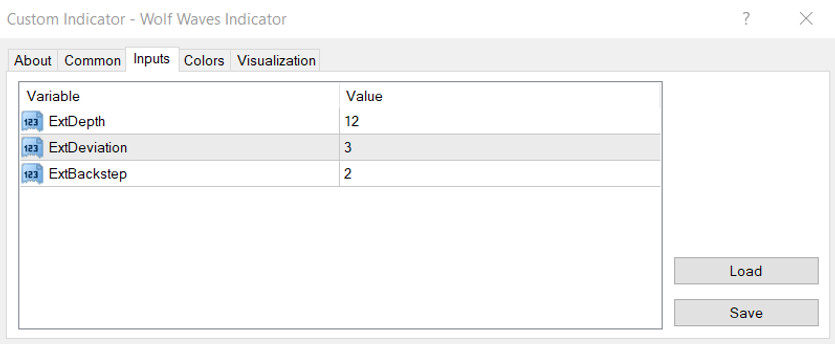
All parameters available for editing are ZigZag settings, according to which the waves are built:
ExtDepth - Zig-Zag depth value;
ExtDeviation - Zig-Zag deviation value;
ExtBackstep - Zig-Zag Backstep value;
Indicator signals
Bullish pattern formation rules:
Point 1 is the first of three model definition points;
Wave 1-2 is the basic foundation of the pattern. The whole model is its continuation;
Point 2 is the first high of the swing price movement. Necessarily located above point 1;
Point 3 is the second of three model definition points. This is the minimum reached after wave 1-2. Necessarily located on the chart below point 1;
Wave 3-4 is the second wave in the pattern;
Point 4 is the high of the second wave of our pattern. Necessarily located below the second and above the third point;
Point 5 is the third of the model definition points. This is the minimum reached after wave 3-4. It is located on a line drawn from point 1 to point 3. It must be below the third point. This is the entry point. It is upon its achievement that the pattern is considered acceptable to start trading;
Points 1-3-5 are on the same line;
Point 6 is the target. It is located on the line drawn from point 1 to point 4. Upon reaching point 6, all positions are closed, and the pattern is considered completed;
Wave 5-6 is the strongest and only traded Wolf wave;
Points 1-4-6 are on the same line.
Rules for the formation of a bearish pattern:
Point 1 is the first of three model definition points;
Wave 1-2 is the basic foundation of the pattern. The whole model is its continuation;
Point 2 is the first high of the swing price movement. Necessarily located below point 1;
Point 3 is the second of three model definition points. This is high to be reached after wave 1-2. Necessarily located on the chart above point 1;
Wave 3-4 is the second wave in the pattern;
Point 4 is the low of the second wave of our pattern. Necessarily located above the second and below the third point;
Point 5 is the third of the model definition points. This is high to be reached after wave 3-4. It is located on the line drawn from point 1 to point 3. Necessarily located above the third point. This is the entry point. It is upon its achievement that the pattern is considered acceptable to start trading;
Points 1-3-5 are on the same line;
Point 6 is the target. It is located on the line drawn from point 1 to point 4. Upon reaching point 6, all positions are closed, and the pattern is considered completed;
Wave 5-6 is the strongest and only traded Wolf wave;
Points 1-4-6 are on the same line.
Conclusion
Many different algorithms have been created to construct Wolf waves. Each of these indicators, to some extent, solves the problem of finding Wolf waves, but none of them fully solves it. Even if you do not take into account pure subjectivity, a large set of factors still affects the appearance of the figure. In the real market, it is rarely possible to get a perfect figure, which is why goals are often too optimistic. To solve this problem, traders draw additional targets by drawing lines at adjacent extremums or introduce trailing stops.

