For the traders to be able to make relatively easy trading decisions and to execute potentially profitable trades, at first, they need to be able to pick proper trading tools - wisely. However, such trading tools are not only different technical indicators, but this category also includes the mapping methods – the various types of charts that this article will focus on.
So, let’s take a step forward and take a look at the respective mapping methods.
Candle charts
In these days, the majority of traders use candle charts on a daily basis as well as their modifications (e.g., Renko), based thereon. However, it’s pretty clear that the basic candle charts may provide significantly more information to traders than their modifications.
From the candles, traders may gain not only information about market momentum but about, e.g., volatility (scope of the candles) and market strength (size of candle body) respective to the time period as well.
Therefore, candles may provide numerous information to traders, however, do traders need to know all candle formations, for example?
Bar charts
In comparison to candle charts, bar charts allow the trader to gain less information as they are formed as connections of the closing prices of certain intervals. However, the advantage of these charts is that the “noise” specific for candle charts, is filtered away.
Cases when it’s appropriate to use bar charts:
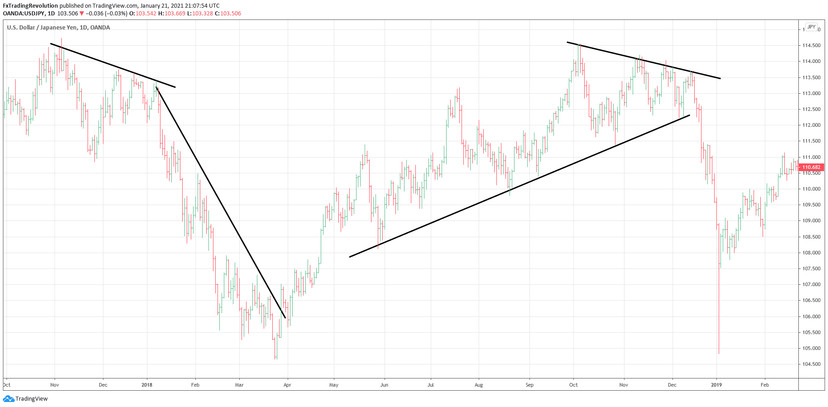
Bar charts represent an ideal option for analyses of longer timeframes when the traders are not focusing on achieving as many detailed information as possible, but often they want to gain information about market flows, directions, and trend structure. As we can see on the image below, thanks to the elimination of noise, bar charts may help to gain information easier about, e.g., not only trend slopes but also about support and resistance levels.
Unfortunately, in some situations, as, e.g., the placing of stop loss, take profit or any other orders when working with “market details” is required, bar charts are not sufficient anymore, and therefore, it’s necessary to gain enough information from the candle charts explained above.
Based on this, experienced traders often combine bar charts with the candle charts.
Dot-charts (Tic Tac Toe)
In spite of the previous chart, the dot types of charts are not based on time. Instead, these charts are fully based on price movements. Thanks to the fact that these charts are not affected by time, there won’t be any additional moving force if markets (on time charts) move sideways, so there is no further information (candle, bar, etc.) on dot charts at the moment.
Cases where it’s appropriate to use dot charts:
Based on the above, dot charts are kind of a momentum indicator, so they are appropriate for trend and breakout strategies, as right these strategies take their top potential from the momentum of given markets.
Conversely, a significant disadvantage of dot charts are the “market gaps,” reflected in dot charts in a way that it looks like no price jump even occurred. Therefore, they become “invisible” from the traders’ point of view.
Conclusion:
Trading with only one “best” method of mapping does not have to be the best approach as it’s always better to choose combination providing traders more information not only in case of mapping, but also in case of indicators, and thus the traders may gain more comprehensive view.
If you would like to try out trading on your own with top tier trading conditions and professional forex broker, don’t hesitate and try our demo account that may be open on our website completely for free and free of any risk: www.purple-trading.com
About the Author

Team Purple Trading
Purple Trading is a true and 100% fair ECN / STP forex broker providing direct access to the real market. High speed orders execution, no trade-offs, no limits for any type of trading, the most advanced trading technologies. Explore more about Purple Trading at www.purple-trading.com .
CFDs are complex instruments, carrying a high level of risk of losing the entire investment as a result of leverage. 67.6% of retail investors lose their capital when trading CFDs with this provider. This value was set within the period from April 1, 2018, to March 31, 2019. You should carefully consider if you understand how CFD instruments work and if you can undertake such high risk of losing you initial investment.
Trading forex exchange with margin carries a high level of risk and may not be suitable for all investors. The high degree of leverage can work against you as well as for you. Before deciding to trade foreign exchange you should carefully consider your investment objectives, level of experience, and risk appetite. You could lose part or all of your initial investment and therefore you should not invest money that you cannot afford to lose. Seek independent advice if you have any doubts.
Any opinions, news, research, analysis, prices, or other information contained on this website is provided as general market commentary, and does not constitute investment advice. L.F. Investment Limited will not accept liability for any loss or damage, including without limitation to, any loss of profit, which may arise directly or indirectly from use of or reliance on such information.
Purple Trading is a trade name owned and operated by L.F. Investment Limited., a licensed Cyprus Investment Firm regulated by the CySEC lic. no. 271/15.


