A Primer on the Cup and Handle Pattern
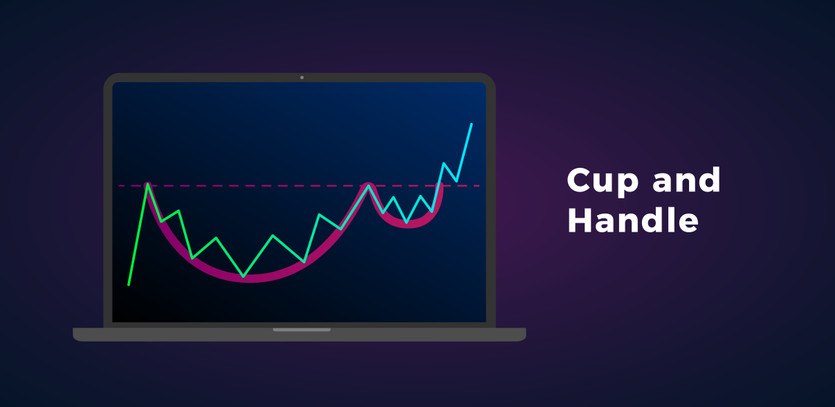
Imagine a chart where the asset's price follows a U-shaped curve, mimicking a teacup, with the trajectory typically trending downwards. This is the classic cup and handle pattern seen in technical analysis. Identified as a bullish continuation pattern, it suggests a probability of a price surge once the formation completes. To execute successful trades employing this pattern, it's crucial to accurately recognize it, initiate purchase at an intelligent entry point, apply stop-loss for risk management, and establish a price target for a lucrative exit.
Key Points to Remember
The cup and handle pattern, mirroring a U with a horizontal line, customarily trends downward. Being a bullish pattern, there is a potential of an upward turn in stock prices post its completion. The formation of this pattern can extend over weeks or even months. Traders utilize this indicator to pinpoint buying opportunities with a forecast of a price escalation. However, there's no guaranteed surge in stock prices; hence, deploying a stop-loss becomes vital in risk management.
What Constitutes a Cup and Handle Pattern?
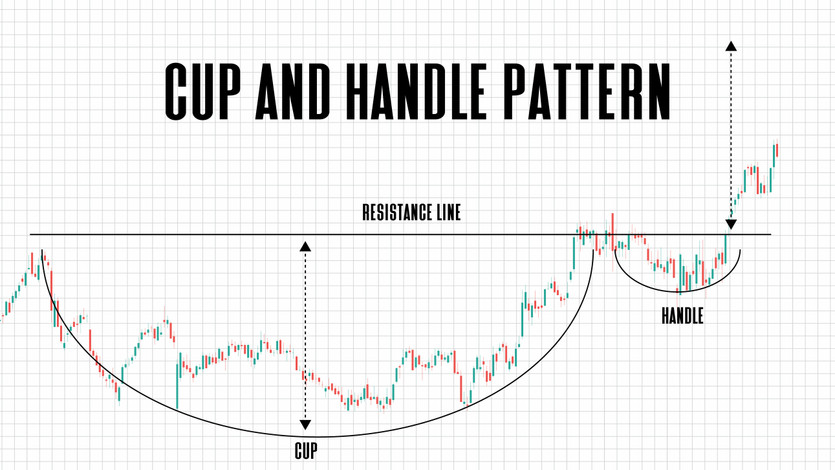
In the trading universe, chart patterns like triangles, rectangles, head and shoulders, and in this context, a cup and handle, serve as visual aids for traders. William O'Neil, a stockbroker, first recognized this pattern in 1988. It materializes when the asset price trends downwards, stabilizes, and then ascends to a level mirroring the prior decline, thus forming the 'cup'. A sideways or marginal downward movement within a confined price range follows, constituting the 'handle'.

Key Consideration
The handle should be smaller than the cup. The price, which trends lower to form the handle, should not reach the lower half of the cup. Ideally, the price should stay within the upper third of the cup's height. If the handle descends too far, negating most of the cup's gains, it's advisable to abstain from trading the pattern.
This pattern can emerge in varied time frames, from one-minute charts to daily, weekly, or even monthly charts.
How to Trade a Cup and Handle Pattern
The cup and handle pattern is a highly valuable tool that many traders utilize to predict potential bullish moves in the market. While recognizing the pattern is an important step, the actual trading process entails several considerations to maximize profitability and minimize risks. Here is an extended guideline on how to effectively trade this pattern.
1. Identification and Confirmation of the Pattern:
This is the first and most critical step. Be patient and ensure the pattern is properly formed before any trading action. A typical cup and handle pattern consists of a cup formation (a U or V-shaped price movement) followed by a handle formation (a smaller and typically downward trend within a confined range). Confirm the pattern's validity by observing that the handle does not drop into the lower half of the cup, and is, in fact, ideally within the upper third of the cup's depth.
2. Monitor the Volume:
During the formation of the cup and handle, volume plays a significant role. Typically, volume diminishes as the price falls into the cup, then increases slightly as the price rises back to the previous high. In the handle formation, the volume usually decreases, signaling a lack of selling pressure. Once the breakout from the handle occurs, ideally, it should be accompanied by a surge in volume. This indicates strong buying pressure, reinforcing the bullish sentiment.
3. Entry Point:
The ideal entry point for trading a cup and handle pattern is when the price breaks above the resistance line formed by the handle's peak. This is known as a breakout point. It's wise to wait for the price to close above the resistance line rather than entering the trade during the breakout, which can prevent being caught in a false breakout. Some traders prefer waiting for a retest of the breakout line before entering the trade. While this might mean a missed opportunity if the price doesn't retest, it can provide a more secure entry point.

4. Setting Stop Loss:
Setting a stop loss is crucial for effective risk management in trading any pattern, including the cup and handle. A common location for a stop-loss order is just below the lowest point in the handle. If the price fluctuates within the handle, you can consider placing a stop-loss below the most recent swing low. The key idea is to prevent the trade from reaching the lower half of the cup formation. This step ensures that you're covered if the trade moves against your expectations, limiting potential losses.
5. Price Target:
Your price target should be a reflection of the depth of the cup. To calculate it, measure the distance from the bottom of the cup to the pattern's breakout point (top of the handle), then project that distance upward from the breakout point. This is your minimum price target for the trade, offering a quantifiable goal that allows you to gauge when it may be a good time to sell.
6. Stay Flexible:
Finally, it's essential to stay flexible when trading any pattern, including the cup and handle. No pattern is 100% reliable, and prices may not always reach your calculated target. The market could also change direction before your stop-loss is triggered. Being adaptable to changing market conditions is crucial for long-term trading success.
In conclusion, trading the cup and handle pattern involves careful identification, strategic entry and exit points, risk management, and flexibility. By mastering these steps, you can enhance your trading performance and make more informed decisions.
Additional Considerations
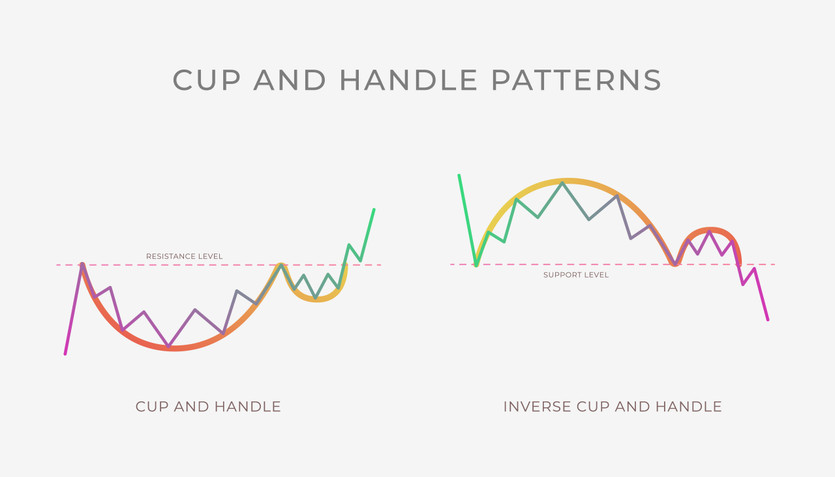
Traders should be aware of the inverted cup and handle pattern, which could suggest a potential downtrend in the asset's price. This pattern appears as an upside-down cup with the price of an asset trending downwards, then rising, stabilizing, and descending again, followed by an upward-pointing handle. Most general rules, including the handle not exceeding one-third of the cup, still apply.
Trading with the Cup and Handle Pattern
What transpires post a cup and handle pattern?
Post a confirmed cup and handle pattern, a bullish price move upward typically ensues. To better comprehend what might happen after the pattern, larger contextual clues can prove helpful. Is there a long-term uptrend or downtrend? Has the volatility been fluctuating? Answers to these questions can provide invaluable insights.
How to identify a cup and handle pattern?
There's no preset stock scanner setting for locating a cup and handle pattern, but it's easily recognizable visually. You can customize your stock scanner to meet your trading needs and sift through the results until you identify a chart mimicking a cup and handle.


