Introduction to Momentum Indicators: A Vital Trading Tool
In the fluctuating world of stock prices, understanding the dynamics of price movement is crucial. Stock prices might exhibit rapid shifts or more gradual changes. This fluidity can be perplexing to both new and experienced traders. However, with the use of the momentum indicator line on a price chart, individuals can independently assess the rate of these price changes. This essential tool contrasts the latest closing price with a selected prior closing price. Unlike most other tools, the momentum indicator is typically depicted as a distinct line on a chart, setting it apart from the more conventional price line or bars.
Understanding the Momentum Formula: The Mathematics of Movement
Two Versions of the Momentum Formula: Simplicity and Versatility
Determining the momentum of a price is not as complex as it might appear. In fact, there are two accessible versions of the formula. Both provide valuable insights, but in slightly different ways.
- Version 1: �=CP−CPn
- Version 2: �=(CPCPn)×100
Version 1, the simpler of the two, calculates the plain difference between two closing prices. Version 2, on the other hand, finds the rate of change expressed as a percentage. Both versions serve as key instruments to gauge the force behind price movements.
Interpreting the Momentum Indicator: Decoding the Numbers
The momentum indicator does more than provide numbers; it tells a story. It helps traders to identify whether the price is moving upwards or downwards and the strength of that movement. With the first version, a positive outcome indicates the price is above what it was "n" periods ago; conversely, a negative number denotes it's lower.
For the second version, a percentage over 100 signifies that the price has risen compared to "n" periods earlier, while a figure under 100 indicates it has dropped.
The degree to which the indicator is above or below zero or 100 is not a minor detail. It provides a clear picture of how fast or slow the price is moving, making it an essential aspect of trading analysis.
Important Consideration: A Collaborative Approach
The momentum indicator is not an isolated tool. Its effectiveness is amplified when used in conjunction with other trading instruments. Seasoned traders often corroborate it with various other indicators when deciding what and when to buy or sell, creating a layered, multifaceted approach to trading.
Practical Application in Trading: Strategies and Techniques
100 Line Cross: A Fundamental Trading Strategy
The 100 Line Cross strategy is more than a mere tactic; it's a cornerstone for many traders. When the price crosses above or below this critical line, it can signal buying or selling opportunities. Understanding these crossings can mean the difference between a successful trade and a missed opportunity.
However, the 100 line cross is not without its challenges. It is susceptible to "whipsaws," or sudden reversals that can catch traders off guard. By filtering signals based on current trends, traders can often navigate around this pitfall.
Crossover Technique: An Advanced Strategy
This method requires a bit more finesse and involves adding a moving average line to the indicator. Timing is everything with the crossover technique. Buying occurs when the momentum indicator ascends above the moving average, and selling when it descends below.
Like the 100 line cross, this technique faces the whipsaw issue. However, by aligning trades with the trending direction and experimenting with various settings, this can be managed and even turned to an advantage.
Divergence: Spotting Subtle Shifts
Divergence represents an elegant way to identify potential market shifts.
- Bullish divergence: Occurs when the price is declining, but the lows on the momentum indicator are ascending.
- Bearish divergence: Happens when the price is escalating, but the highs on the momentum indicator are descending.
Though subtle, divergence can be a strong ally in confirming trade signals. It should never be used as a trading signal on its own but always in combination with other strategies.
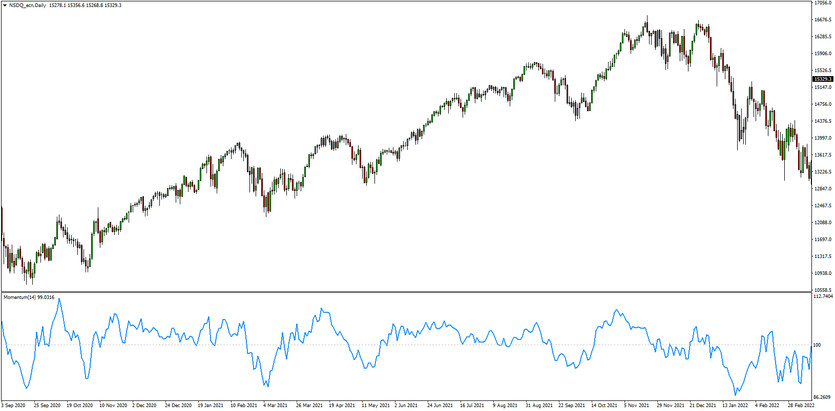 The momentum oscillator applied on the NASDAQ daily chart
Caveats and Considerations: A Note of Caution
While powerful, the momentum indicator has its limitations. It often echoes what's already visible on the price chart. It may be most useful in spotting subtle shifts in buying or selling pressure, especially through the use of divergence. However, it's best deployed to corroborate a price action trading strategy, rather than as an independent source of trade signals.
Additional Insights into Momentum Indicators: Exploring Variations and Applications
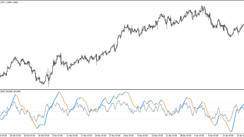
The Stochastic Momentum Indicator: A Window into Market Conditions
In the realm of momentum indicators, one variant that commands attention is the stochastic momentum indicator. This specialized tool is actually a more sophisticated twist on the stochastic oscillator, a popular momentum measurement.
What sets the stochastic momentum indicator apart is its ability to gauge whether a stock is in an overbought or oversold state. It's not just about raw numbers; it's about understanding market equilibrium. By producing readings that range from -100 to 100, the stochastic momentum indicator provides a clear view of market balance. A reading of 100 represents the most overbought condition, while -100 signifies the most oversold.
Traders who master this nuanced indicator often find it offers unique insights that can inform smarter, more targeted trading strategies.
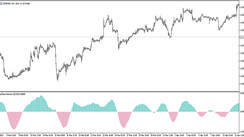
The Squeeze Momentum Indicator: A Complex Tool for Modern Traders
Another compelling development in momentum indicators is the so-called squeeze momentum indicator, or "TTM squeeze." While it may sound cryptic, its principles are rooted in established financial theory.
The squeeze momentum indicator cleverly melds two existing tools: the Bollinger Bands and the Keltner Channels. Through this fusion, it offers a more granular understanding of volatility patterns and directional momentum.
Here's what it does in essence:
- When the Bollinger Band is within the Keltner Channel, it suggests a period of low volatility.
- By comparing these patterns and aligning them with momentum, the squeeze momentum indicator helps traders forecast sudden volatility spikes in a particular direction.
This isn't just a convenience; it's a revolution in how traders can anticipate market movements.
Conclusion: Embracing Momentum Indicators as an Integral Part of Trading
From the basic formulations of momentum to the more advanced stochastic and squeeze momentum indicators, these tools form a rich tapestry that every trader can explore. Understanding and utilizing these indicators is not a mere enhancement to trading; it's a fundamental aspect of modern financial strategy.
Whether you're a seasoned trader seeking to refine your approach or a newcomer eager to grasp the core concepts, momentum indicators offer an exciting pathway. Embracing these tools means embracing a more sophisticated, informed, and potentially successful trading experience.
In a world where markets never sleep and where every fluctuation can signify an opportunity or a threat, momentum indicators stand as vigilant sentinels. They are the silent allies of traders, always ready to reveal the hidden currents of the financial world.