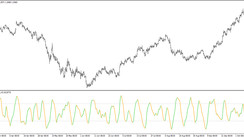
Technical analysis is a method of analyzing financial market data to identify trends and patterns that can be used to predict future price movements. Technical analysts use a variety of tools and indicators to analyze market data, including charts, patterns, and indicators.
Types of technical analysis tools
There are many different types of technical analysis tools, each with its own strengths and weaknesses. Some of the most common types of technical analysis tools include:
Charts: Charts are a visual representation of market data. They can be used to identify trends, patterns, and support and resistance levels.
Patterns: Patterns are recurring price movements that have a high probability of repeating themselves. Some common patterns include head-and-shoulders patterns, double tops, and double bottoms.
Indicators: Indicators are mathematical formulas that use market data to generate signals. Some common indicators include moving averages, relative strength indexes, and stochastic oscillators.
Which technical analysis tools are the most and least effective?
There is no single technical analysis tool that is the most effective. The effectiveness of a particular tool depends on the market conditions and the individual trader's trading style. Some tools, such as moving averages, are more effective for identifying trends, while other tools, such as stochastic oscillators, are more effective for identifying overbought and oversold conditions.
How do technical analysis tools work?
Technical analysis tools work by analyzing historical market data to identify patterns and trends. These patterns and trends can then be used to predict future price movements. For example, a moving average is a technical analysis tool that calculates the average price of a security over a certain period of time. Moving averages can be used to identify trends and support and resistance levels.
Technical analysis tools are not necessary for trading. However, they can be a valuable tool for traders who want to identify trends and patterns in the market. Technical analysis tools can also help traders to identify potential entry and exit points for trades.
Additional tips for using technical analysis tools
Using multiple tools. No single technical analysis tool is perfect. By using multiple tools, traders can get a more complete picture of the market.
Backtesting your strategies. Backtesting is a process of testing a trading strategy on historical data. Backtesting can help traders to identify the strengths and weaknesses of a particular strategy.
Using risk management. Risk management is essential for any trader. Traders should always use stop-loss orders to limit their losses.
Conclusion
Technical analysis is a valuable tool for traders who want to identify trends and patterns in the market. However, it is important to remember that technical analysis is not a perfect science. Past performance is not necessarily indicative of future results. Traders should use technical analysis tools in conjunction with other factors, such as fundamental analysis, to make informed trading decisions.


