
In the realm of technical analysis, understanding the genesis of new trends is paramount. However, another equally crucial aspect is the ability to pinpoint the cessation of these trends. Indeed, executing a perfectly-timed trade entry is of little use without a correspondingly well-timed exit.
Introduction to Parabolic SAR (Stop And Reversal)
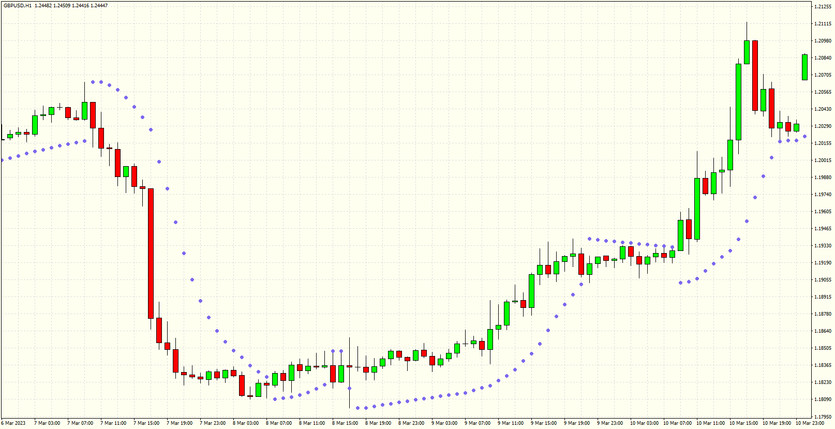
A powerful tool aiding in determining the potential culmination of a trend is the Parabolic SAR (Stop And Reversal). This unique indicator manifests as dots, or points, on a chart, suggesting possible shifts in price direction. As can be observed in the accompanying image, these points transition from being beneath the candles during an upward trend to above them when the trend reverses into a decline.
Implementing Parabolic SAR in Trading
The beauty of the Parabolic SAR is its sheer simplicity. Its implementation is truly straightforward. In essence, when the dots appear beneath the candles, it signals a buying opportunity, and when they surface above the candles, it signifies a selling signal.
In the most simplistic terms, it's safe to say this indicator is probably one of the easiest to interpret since it assumes the price is moving in one of two directions - upwards or downwards. However, this tool finds its best application in trending markets characterized by extensive rallies and downturns. It's not recommended to utilize this tool in a volatile market exhibiting sideways price movement.
Utilizing Parabolic SAR for Trade Exit Decisions
Beyond its fundamental use, the Parabolic SAR can also guide you on whether to close your trade. For instance, when EUR/USD began its downward spiral in late April, the continued decline may have suggested an indefinite drop.
A trader who had shorted this pair might have been uncertain about how much lower it could go. However, in early June, the formation of three dots at the price base suggested an end to the downtrend, signaling it was time to exit those shorts. If you had held on to that trade in the hopes of a further drop in EUR/USD, you would have likely lost all the gains as the pair gradually ascended back near 1.3500.
The Parabolic SAR: An Overview
The parabolic SAR, conceptualized by renowned technician J. Welles Wilder Jr., is predominantly employed by traders to gauge the imminent short-term momentum of an asset. Its complex calculation is secondary to its practical application in trading, which enables traders to ascertain where stop orders should be positioned. The Parabolic SAR not only assists in identifying trends but also indicates when to reverse the direction of your trade.
Decoding the Parabolic SAR Calculation
While the detailed calculations are handled by trading platforms like MetaTrader 4 (MT4) and MetaTrader 5 (MT5), a basic understanding of the Parabolic SAR formula can enhance your knowledge of how this indicator functions.
• The Parabolic SAR serves as a technical pointer to ascertain short-term momentum and determine where to place stop orders.
• Traders often set trailing stop-loss orders at the SAR value, anticipating a reversal if the price moves beyond this level.
• The indicator is depicted on the asset's chart as a series of dots placed either over or below the price, based on the asset's momentum.
• Ideally, the Parabolic SAR performs optimally in steadily trending markets.
• It is crucial to note that the Parabolic SAR calculation is rather intricate.
Deciphering the Parabolic SAR
Interestingly, this indicator operates on the assumption that a trader is always invested in a position. Consequently, it is particularly beneficial to those developing trading systems and traders who aim to maintain constant market engagement.
The Parabolic SAR indicator is graphically represented as a series of dots either above or below the price, depending on the asset's momentum. A small dot is located below the price during an upward trend, while it is situated above the price during a downward trend.
Many traders prefer to place their trailing stop-loss orders at the SAR value as a price movement beyond this suggests a reversal, leading the trader to anticipate a counter-directional move. In a consistent trend, the Parabolic SAR tends to be sufficiently distant from the price to avoid traders from being stopped out due to temporary retracements, allowing traders to ride the trend for an extended duration and secure substantial profits.
Parabolic SAR in Different Market Conditions
The Parabolic SAR performs at its peak in steadily trending markets. In markets with significant fluctuations, the Parabolic SAR tends to swing back and forth, resulting in erroneous trading signals. To combat this, Wilder advised supplementing the Parabolic SAR with the average directional index (ADX) momentum indicator to get a more accurate estimation of the prevailing trend's strength.
Some traders may also consider candlestick patterns or moving averages. For instance, a price falling below a key moving average could confirm a sell signal indicated by the Parabolic SAR.
Concluding Thoughts
Wilder famously stated that the Parabolic SAR "extracts more profit out of an intermediate move (lasting two or three weeks) than any method I know." Although decades have passed, its enduring popularity testifies to its effectiveness. Moreover, the indicator can be adapted to a diverse range of time frames beyond the mentioned quote.
Regardless of whether you're applying a Parabolic SAR strategy to shorter time frames, such as tick charts, or longer ones like daily or weekly charts, the fundamental principle remains consistent. The crucial requirement is to ensure you're trading in a truly trending market.