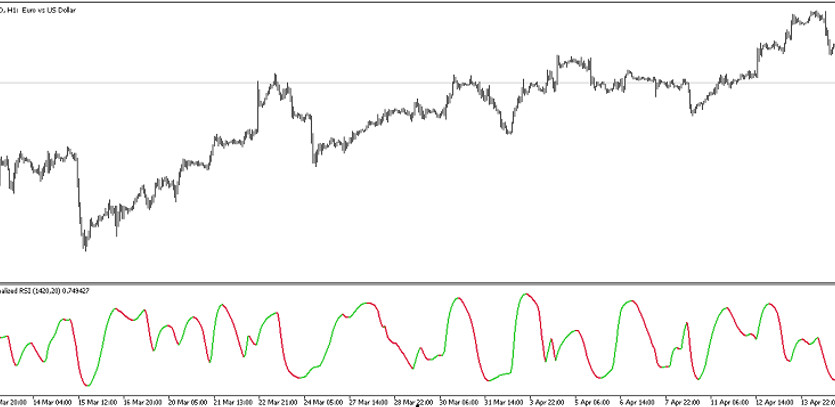
The Sigmoidal Normalized RSI indicator is a modification of the standard RSI forex indicator. Its calculations are based on the use of a standard forex indicator with additional smoothing of calculations that are aimed at determining the direction and strength of the current trend and opening certain trades during this period. The indicator is displayed in the lower window of the price chart in the form of a solid line, which, under certain market conditions, changes its color and direction. Thus, taking into account the direction of the current trend, which in turn is determined by the values of the indicator line, a corresponding trade can be opened.
The Sigmoidal Normalized RSI indicator is suitable for use on any time frame, with any currency pair.
Input parameters
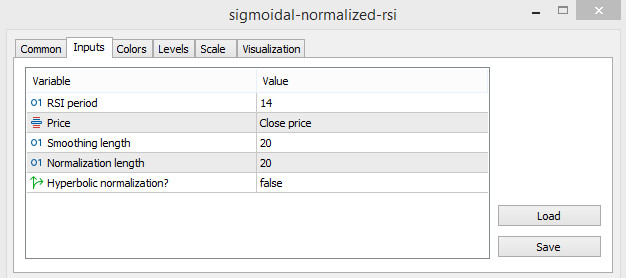
The settings of the Sigmoidal Normalized RSI indicator consist of several sections. Thus, its Input Parameters section is responsible for its technical work and the general functioning of the calculations. To change the color scheme and general visualization of the indicator, the Colors section is used, and to add signal levels to its window -the Levels section.
-RSI period - value of the period of the RSI indicator. The default value is 14.
-Price - type of the price to which the indicator calculations are applied. By default, it has the Close price value.
-Smoothing length - the length of the smoothing applied to the current calculations of the indicator. The default value is 20.
-Normalization length - normalization value for the current indicator calculations. The default value is 20.
-Hyperbolic normalization? - option to use hyperbolic normalization of calculations. The default value is false.
Indicator signals
The Sigmoidal Normalized RSI indicator is very easy to use due to its convenient visualization. To open a certain trade, it should only considered the direction and strength of the current trend, which in turn are determined by taking into account the direction and color of the indicator line. If the indicator signals an upward trend, buy trades are opened, while sell trades are opened during a downward trend. Trades are closed during a trend change in both cases.
Signal for Buy trades:
- The indicator line is colored with the growth value and moves upwards.
Upon receipt of such a condition, a buy trade can be opened on the signal candle, conditioned by the presence of an uptrend in the current market. It should be closed upon receipt of the opposite conditions from the indicator, namely, when the color and direction of its line change. At this moment, one should expect a change in the current trend and prepare to open new trades.
Signal for Sell trades:
The indicator moves from top to bottom and has a color with a falling value.
A sell trade can be opened upon receipt of a full combination of conditions that characterize the presence of a downtrend in the market. When the current trend changes, namely, when conditions opposite to the current conditions are received, a sell trade is closed. At this moment, it should be considered opening new trades.
Conclusion
The Sigmoidal Normalized RSI indicator is an efficient trading algorithm whose calculations consist of using an indicator whose accuracy has been proven by time and improved by additional smoothing. The indicator is very easy to use, however, in order to fully understand the operation of the algorithm and gain the necessary trading skills, preliminary practice on a demo account is recommended.