Candlestick charts are the densest type of price charting because candlesticks communicate the open, low, high, and close all within a single bar-like structure. These candlesticks and their structure can also yield important clues about what is happening in the market and present actionable patterns that we can use to interpret the market.
Identifying Candlestick Patterns
Candlestick patterns can be formed by a group of candles or by the appearance of a single candle. There are many candlestick patterns that traders have found useful for interpreting the market. We will cover some of the most popular.
Hammer And Inverted Hammer
The hammer is a candlestick that looks like a hammer with the head on top. The body of the candle has no upper tail, or a very short one, and a long lower tail.
The combination of the long bottom tail and the body at the top gives it the resemblance of a hammer. The inverted hammer is just the opposite of the hammer, with the body on the bottom, with no bottom tail or a very short one, and a long upper tail. The hammer is most significant when it appears during a downtrend.
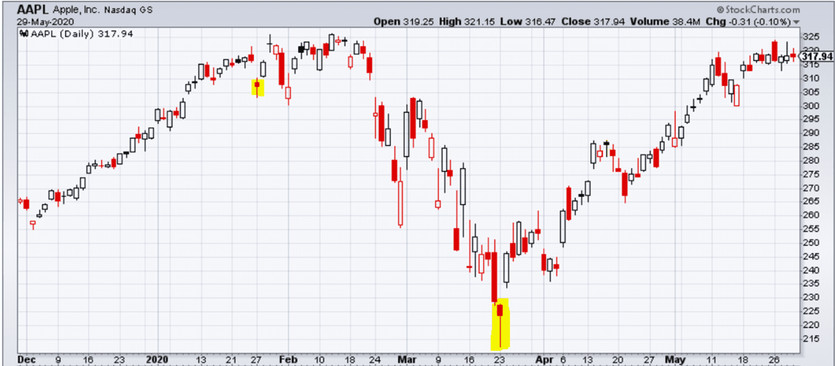
Multiple hammers and inverted hammers can be seen in the chart of Apple (NASDAQ: AAPL) below. Notice how the price reverses after the candle appears.
The hammer is significant because the long tail represents a continuation of the current trend, but that continuation is reversed and price settles near the opposite end of the candle. It is a bullish reversal pattern and suggests that the trend is about to reverse.
By watching to ensure that a reversal of the trend actually does begin and validating the uptrend by confirming it has an increase in trading volume, you can enter a trade confident that a profitable uptrend has begun.
Bullish Engulfing Candle
This pattern is formed by two candles. The bullish second candle is said to “engulf” the bearish first candle because the body of the second candle covers the entire range of the previous candle. The engulfing pattern is a reversal pattern.
The bullish second candle opened lower than the first candle and the buying pressure was still significant enough to push the close above the previous bearish candle.
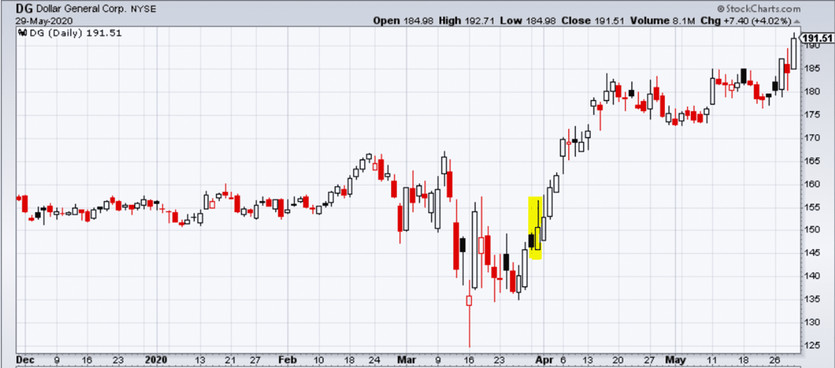
This suggests a significant amount of buying pressure. Look at the following example of a bullish engulfing candle in Dollar General (NYSE:DG). The second candle is bullish and its body covers the entire range of the previous bearish candle. The price continues to move on up from there.
Morning Star
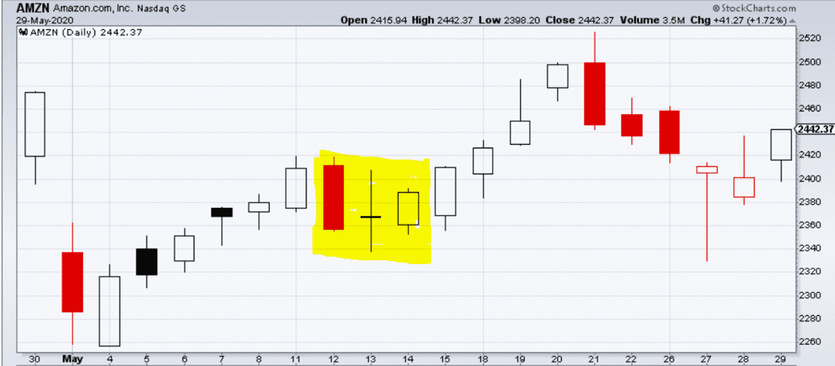
The morning star pattern is composed of three candles. The middle of the three candles is a doji candle, a short-bodied candle. The doji candle sits between a long bearish candle and is followed by a long bullish one. There must be no overlap between the body of the doji candle and the previous bearish candle. Whether the doji candle itself is bearish or bullish is insignificant.
This pattern is significant because the long bearish candle shows selling pressure is followed by the doji candle. The doji candle shows that buying and selling pressure reached a stalemate during the period. When the doji candle is followed by a long bullish candle, it suggests that we have seen a reversal from a bearish trend into a bullish one.
When the bullish candle is accompanied by higher volume, it is further confirmation that this is the case. An example of the morning star pattern appears on the Amazon (NASDAQ:AMZN) chart below.
Three White Soldiers
Three white soldiers is a three-candle pattern consisting of long bullish candles each of which opens within the body of the previous candle and close higher than the previous candle. This pattern often appears after a downtrend. This pattern is significant because it shows consistent buying pressure. The following chart of Dollar General (NYSE:DG) has a three white soldiers pattern highlighted, which foreshadows a bullish trend.