The vast majority of successful Forex strategies are trending strategies. Apart from them, a few counter-trend systems also coexist, which have proven themselves well in terms of their profitability. This system is a striking example of a counter-trend strategy, and due to its approach to trading, it is one of the best in its niche.
At first glance, it seems that counter-trend trading systems are no different from the classic speculative approaches that famous stockists talk about. But they have one unpleasant property - on strong recoilless impulses, many such systems lead to a drain.
Accordingly, if you really want to work against the main trend, you need to do it correctly, taking into account the specifics of the foreign exchange market.
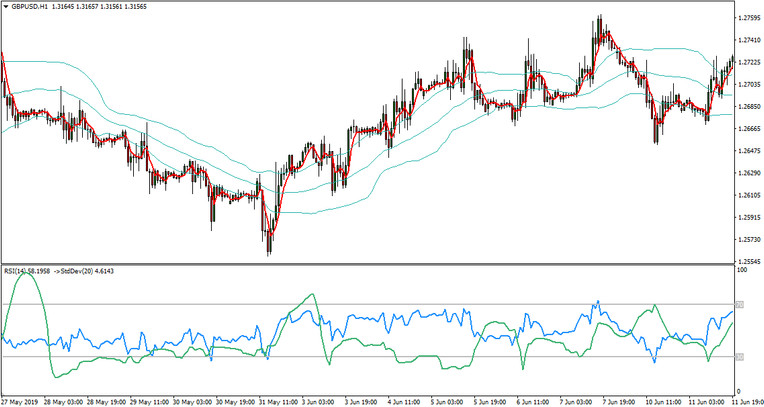
The RSI Deviation & Bands strategy is designed to be applied to the British pound versus dollar major pair on the H1 timeframe and implemented using the MA, RSI, Standard Deviation, and Bollinger Bands indicators.
RSI Deviation & Bands GBPUSD H1 Strategy
System settings
After downloading and installing all these indicators in your MT4 terminal, proceed to the settings.
Open the chart of the GBPUSD currency pair with the H1 timeframe and apply indicators with the following settings to it:
Moving Average indicator with values - Period = 2, MA Method = Smoothed, ApplyTo = Open.
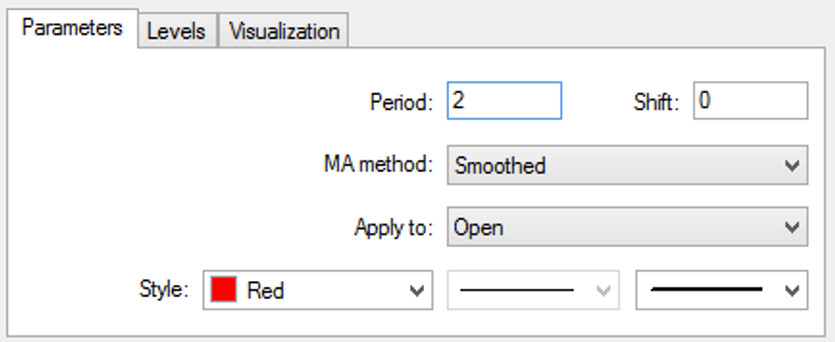
Moving Average in RSI Deviation & Bands GBPUSD H1
Set Bands indicator with period value - 40 and single deviation.
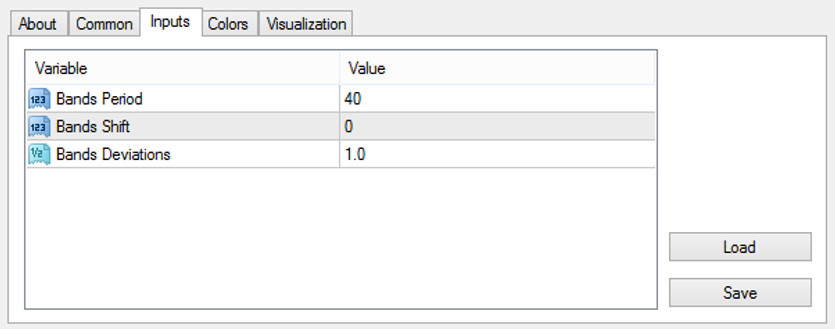
RSI Deviation & Bands GBPUSD H1. Bollinger Bands MT4
Next, set the RSI indicator with RSI Period = 14.
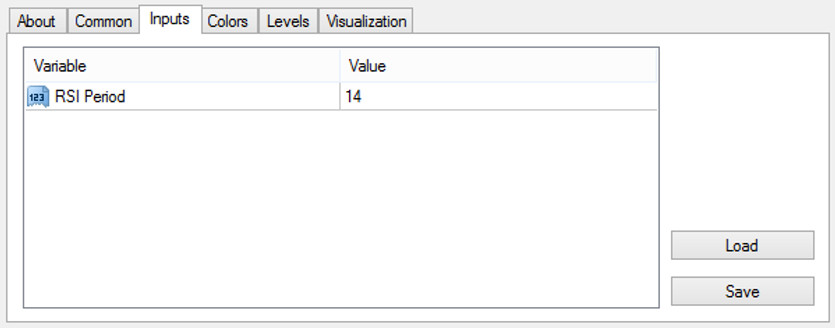
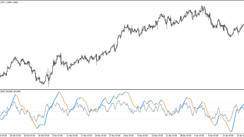
RSI Deviation & Bands GBPUSD H1. RSI indicator
Then drag the Standard Deviation indicator with the values - Period = 20, ApplyTo = Previous Indicator's Data into the RSI indicator window. Uncheck "fix minimum" and "fix maximum."
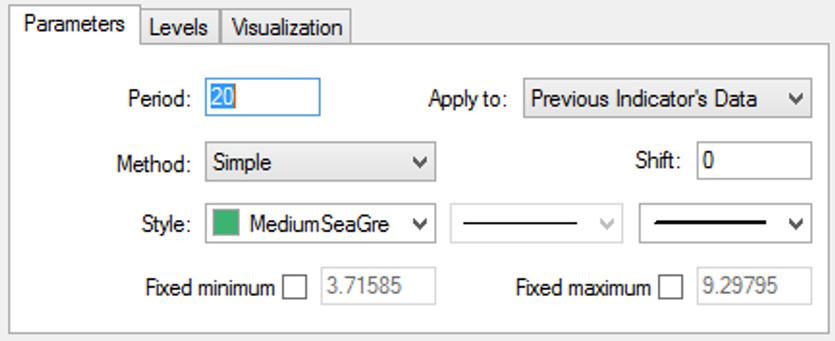
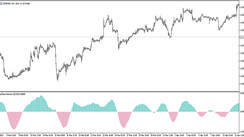
RSI Deviation & Bands GBPUSD H1. Standard Deviation settings
Thus, the system is configured and ready to use.
Rules for opening long positions
Now that all the nuances have been taken into account, you can start looking for entry points, in particular, according to the rules of the counter-trend trading strategy, a buy order is opened if the following criteria are met:
1. The last closed H1 candlestick is below the moving average (MA2).
2. This closed candle is also below the lower line of the Bands indicator.
3. And the third most important condition - the RSI line and the Standard Deviation line crossed below level 30.
If these conditions are met, a BUY deal is opened.
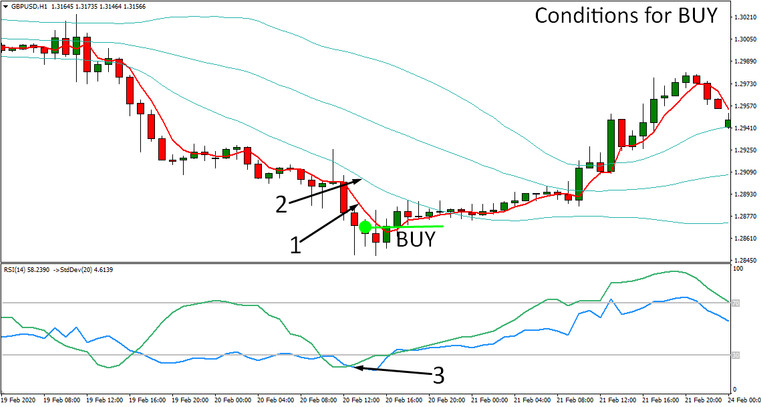
RSI Deviation & Bands GBPUSD H1. Conditions for long position
Rules for opening short positions
A short position is opened in the same way, i.e., before selling a currency pair, you need to wait for the following signals to form:
1. The last closed H1 candlestick is above the moving average (MA2).
2. This closed candle is also above the upper border of the Bands indicator channel.
3. The RSI line and the Standard Deviation line crossed above level 70.
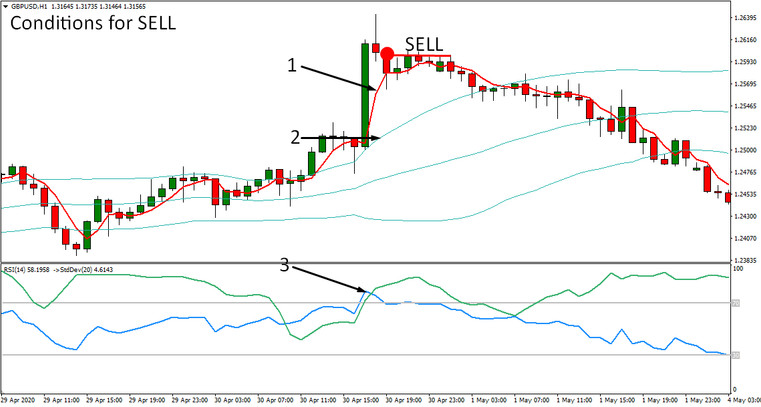
RSI Deviation & Bands GBPUSD H1 . Conditions for short position
Stop-loss and Take-profit
Stop-loss, according to the rules of this strategy, is placed at a distance of 300 points from the opening price of the transaction. Take profit is five times larger than stop loss and is set at a distance of 1500 points from the opening price.
Conclusion
Statistics show that the number of signals for this strategy, on average, is about 3-4 per week, and the approximate profit/loss ratio is 40/60 percent. That is, it turns out that the number of losing trades is greater than that of profitable ones. But considering that a winning trade is five times higher than a losing one, the RSI Deviation & Bands strategy has a pretty good math expectation.