This strategy is based purely on price action. To set things up, load any chart of any market on the five minutes timeframe. Draw key resistance or support levels. Then wait for the price to break above either the resistance or below the support. Then wait for the price to pull back to the just broken level and pick a buy position in case the break was above resistance or pick a sell in case the break was below support. Below you can find an illustration and trade examples of the two cases.
Bullish Breakout
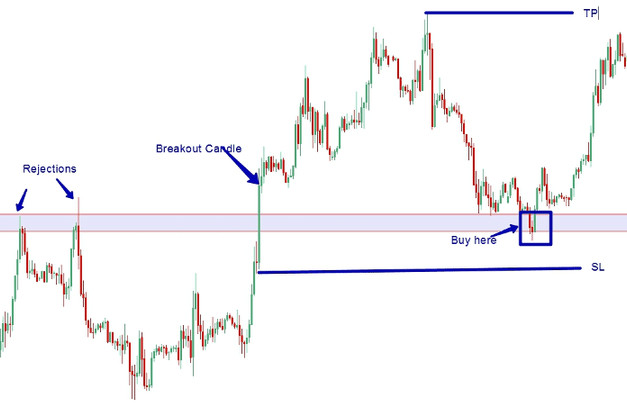
First, find a major resistance level on the 5 minutes chart. Then wait for the price to test this level at least two times, as shown below (rejections). Wait for the price to break and close above this level (breakout). Then wait for a pullback, back to the just broken level to pick a low risk buy position (Buy Here) - after the pullback is confirmed.
Below you can find a live chart of a bullish breakout and trade example.

Setting SL And TP For A Bullish Breakout
Your Stop Loss should be slightly below the candle (its low), which broke above the resistance level, and the Take Profit should be at least 10 pips above the high reached after the breakout (you can adjust this to the current market volatility).
Bearish Breakout
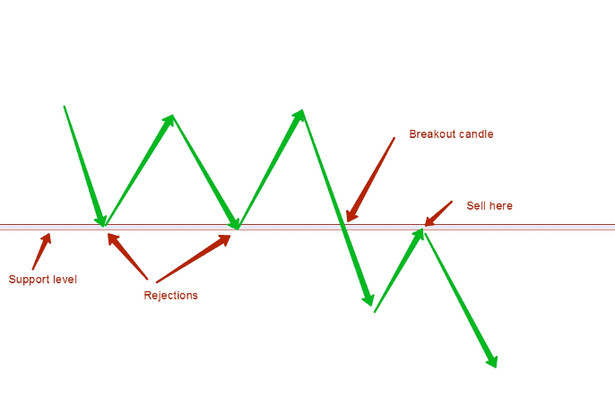
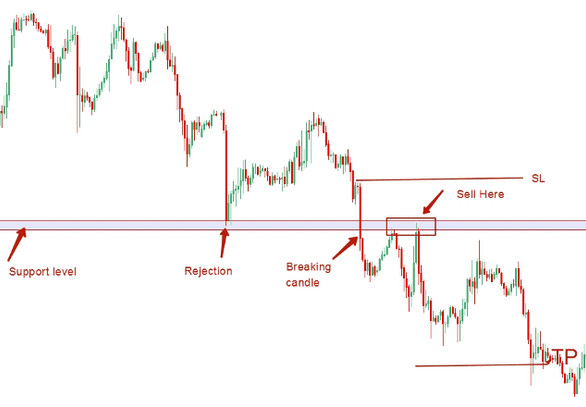
The sell trades are exactly opposite to the bullish breakout. Find a good support level on the 5 minutes chart, wait for the price to test this level at least 2 times. If the price breaks below it and sustains that breakout, wait for a retracement back to the same level to pick a low-risk sell position after the pullback is confirmed.

Below is a real chart of the same scenario:

Setting SL And TP For A Bearish Breakout
Just as in the case with the Bullish Stop loss, in this case, your Stop loss should be slightly above the candle, which broke below the support level (its high). And the Take Profit should be at least 10 pips below the low reached after the breakout (again, you can further adjust it according to the current market volatility).
Conclusion
While this method looks useful on the five-minute charts, it is also successful on the higher timeframes like the 1 hour, 4 hours, and even the daily charts.
Following this strategy on the 5 minutes chart without first knowing the trend on a higher timeframe may be counterproductive. This implies; if you are seeing a bearish breakout on the 5 minutes chart, ensure that there is a downtrend on the 30 minutes chart, and if you are seeing a bullish breakout on the 5 minutes chart, ensure that there is an uptrend on the 30 minutes chart.


