Support and resistance are a foundational part of most technical trading strategies. It’s one of the oldest trading tools used in technical analysis and it’s rightfully so. The concept of prices reversing near support or resistance levels has proven to be a highly reliable method to trade the markets for as long as it’s been used.
There are some differences in how different traders determine support and resistance levels, but in essence, the definition is the same in the trading world:
Support is always below the current price level. Any swing low on the chart is regarded as support. The more pronounced the swing low the stronger the support level is considered to be.
The black lines indicate the support levels on the chart, from the starting point on the left, projected into the future to the right.
Resistance is just the opposite of support.
Resistance is always above the current price level. Any swing high on the chart is regarded as a resistance level. Again, here the more pronounced the swing high is the more significant the resistance level usually is.
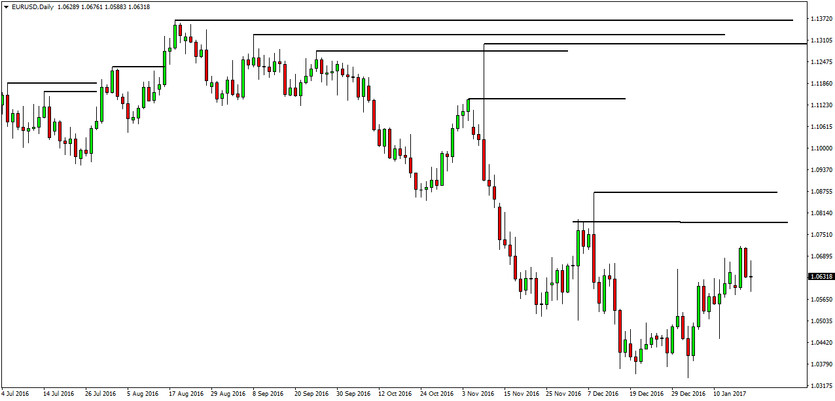
The black lines indicate the resistance levels on the chart, from the starting point on the left, projected into the future to the right.
Remember:
Once the price moves past a support or resistance level it is automatically considered broken and is no longer regarded as support and resistance (the black lines that don’t go all the way to the right are such cases).
A critical thing to understand is that support and resistance act as zones on the chart rather than as clear-cut levels.
For example, if there is support on EURUSD at 1.0655 that doesn’t mean that you must wait for the pair to reach this level and buy exactly at 1.0655. Instead, you use the zone around that level as a support zone and you look for buy signals in that rough zone. Depending on what timeframe you are viewing this support level on, the zone may be 10 pips for intraday charts and 50 – 100 pips for the weekly or monthly chart.
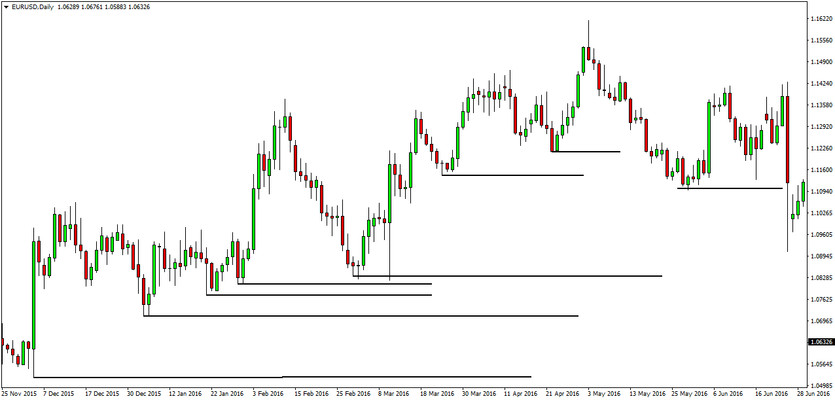
One way to increase the probabilities that a buy or sell signal is valid is to wait for the close of the trading session before taking the trade. So, very often the market will break a support zone during the session, but then will close back above it at the end of the session. This is a support zone that held even though intraday it was broken.
Here’s an example of such a case:
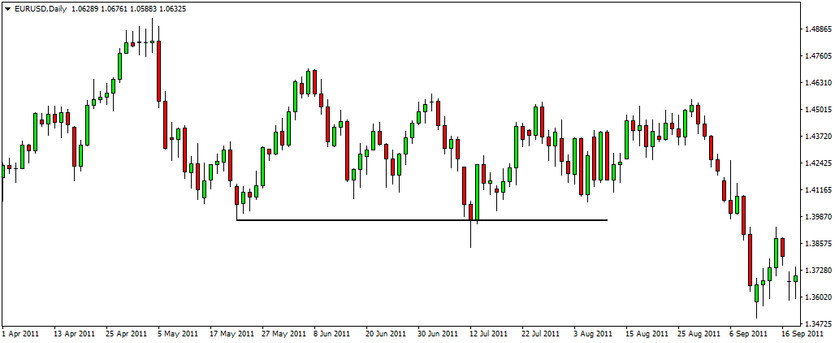
EURUSD Daily chart - Price broke below support during the day but closed above it and then bounced off it completely.
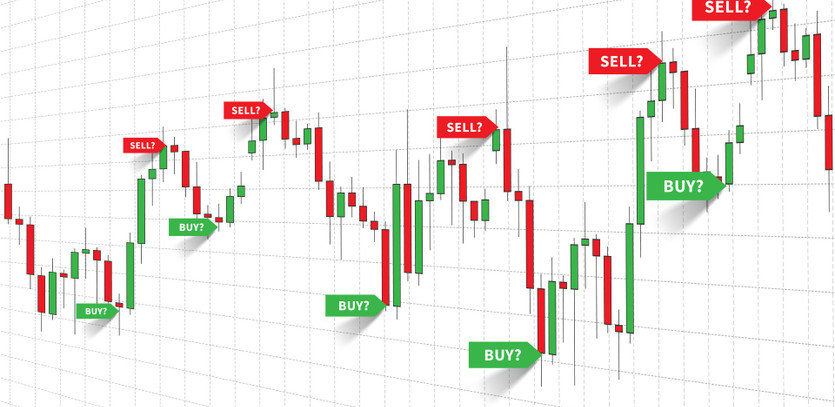
How to trade support and resistance zones?
There are many ways that support and resistance are used in different trading methods. Basically, there are two fundamental ways one can trade support and resistance.
Trading on a reversal
This is the situation where the trader waits for the price to reverse off the support or resistance zone, and then he enters on that bounce in the price. Getting a reversal pattern, or a confirmation signal from an indicator is an additional clue that the trade will be successful.
The main prerequisite here is that the support or resistance zone will hold and the market will actually reverse.
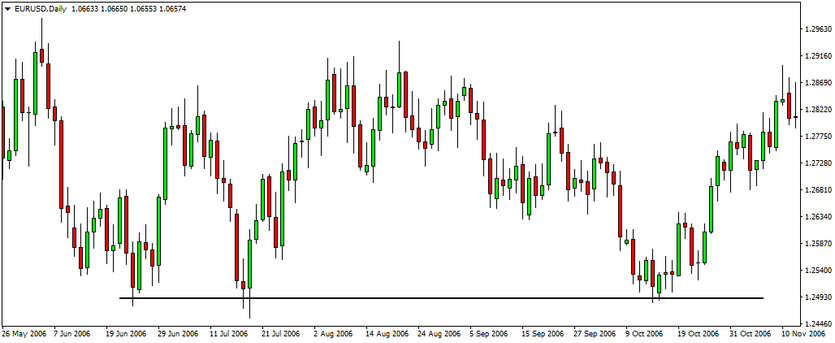
An example of trading the reversal. The two marked areas were valid signals as price bounced off the support area.
Trading on a breakout
This is sort of the opposite of reversal trading. Here the trader waits for the price to break a support or resistance zone and then he enters in the direction of the breakout.
The main assumption here is that support or resistance will be broken and the trend will continue.
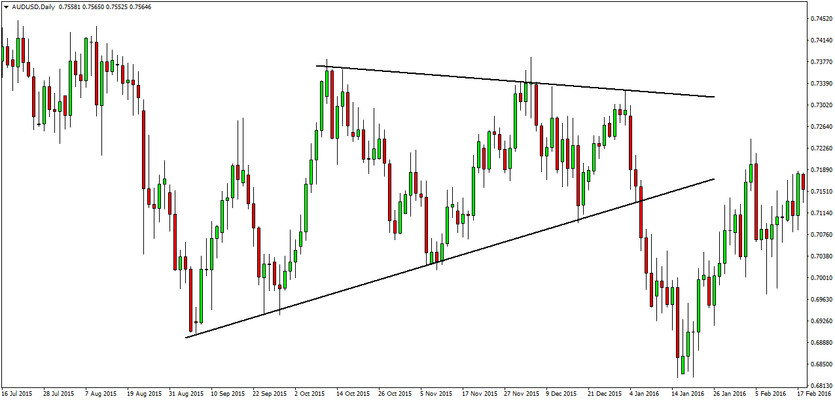
An example of breakout trading in action (entry point in yellow). The downtrend continues after the market broke the support trendline. Note that support and resistance zones can be drawn as a trendline too.
Trading Support and Resistance pullbacks
Another great way to trade the support and resistance zones is to trade pullbacks. A pullback happens if there is a resistance that is broken and becomes a support. After the breakout, a price comes back to retest the S/R zone and retraces back in the direction of the breakout.
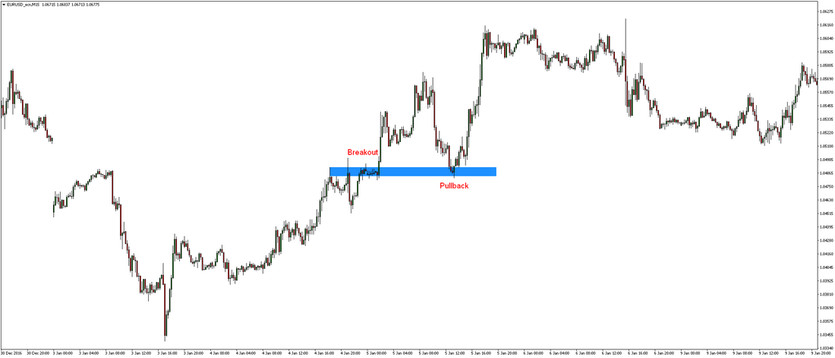
A general rule says that broken resistance can become a support, and broken support can become a resistance. Possible pullbacks are highly effective entry signals.
Place Stop-Loss and Profit-Targets based on Support and Resistance zones
You get the point - support and resistance analysis has no limitations. You can develop a complete trading strategy based on trading entirely the support resistance zones. S/R zones can also very accurately determine where we should set correct Stop-Loss or Profit-Target. Simply if you open a BUY trade, Stop-Loss should be set below supports and Profit-Target below resistances. If you hold a SELL trade, Stop-Loss should be set above resistances and Profit-Targets above supports.
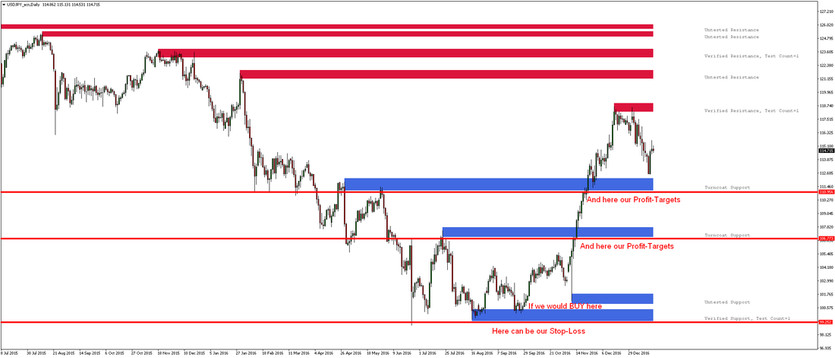
Placing Stop-Loss and Profit-Targer orders based on our free support and resistance indicator.
Keep this in mind when trading breakouts:
Often times the market gives the so-called fakeouts or fake breakouts. To protect from fakeouts many traders have developed different ways in which they trade breakouts, each with its own advantages and disadvantages. There's no single right way how to trade profitably that everyone should choose. Simply try to develop your own strategy, trading approach, gain experience and become a professional trader.
Finally, for an easier way to pick support and resistance levels, you can use our support and resistance indicator that you can download at our website for free.