Understanding the Significance of Trendlines
Trendlines stand as a significant instrument in the sphere of technical analysis, serving as a graphical depiction of trends on a chart. When effectively utilized, they act as a clear, unambiguous, and straightforward guide for traders. In contrast, an incorrect application can render them useless or even detrimental. The key to successful trades often hinges on the adept use of trendlines.
Let's delve into some key insights that will enable you to harness trendlines effectively within your trading strategies.
The Basic Concepts of Trendlines
Trendlines are essentially diagonal markers that underline a trend or cost fluctuations. By trailing the shift in price, they aim to provide a rough estimate of the potential peaks and valleys within a stipulated timeframe. A price surge results in a corresponding trendline ascent, while a price drop triggers a decline in the trendline.
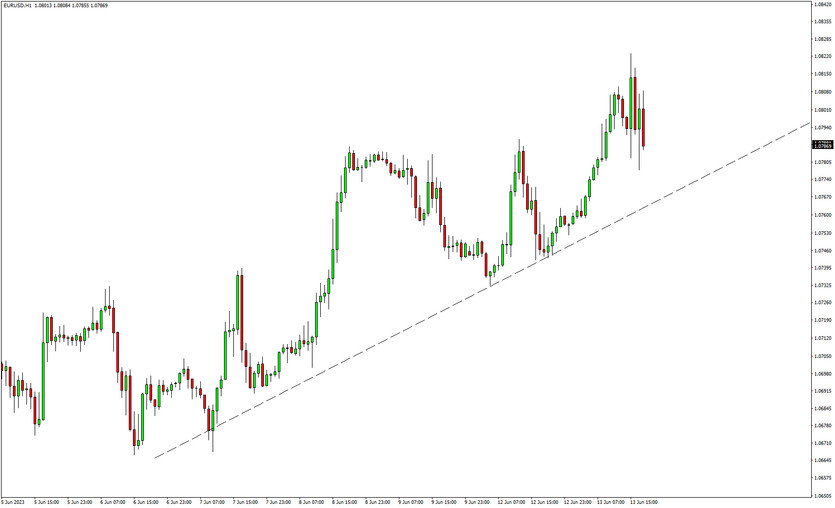
During a period of rising prices, joining the troughs results in an ascending, or "uptrend," trendline. Drawing a trendline along the crests can reveal the gradient of ascent, the power of the price shift, and the relative vigor of the trend.
On the other hand, when prices drop, the peaks also decrease. By joining these declining peaks, we get a descending, or "downtrend," trendline. Similarly, a trendline can be traced along the troughs to demonstrate the slope of descent and the intensity of the downward price movement.
Crafting a Trend Line
Sketching a trendline begins on the left of the chart, extending towards the right. To be valid, a trendline must intersect at least three price ‘swings’.
To construct an uptrend line, start with a low swing on the chart's left side and connect it to a higher swing low.
In the case of a downtrend line, start with a high swing on the left side and link it to a lower swing high.

Employing Trendlines in Trading
Trading using a trendline revolves around deciphering the direction of the price trend. Traders can choose to align with the trend, banking on its continuation, or oppose it in anticipation of a trend reversal. Regardless of the strategy, the interpretation of the trendline remains unchanged.
When the price is above the uptrend line, it implies a bullish, upward trend. Conversely, if the price falls below a downtrend line, it signifies a bearish, downward trend.
Embracing the Trend
The trend-following approach involves buying when prices rise and selling short during a price drop. An uptrend line serves as a reliable method to ascertain whether the general price trend is upward. Conversely, a downtrend line can identify a general downward trend.
Countering the Trend
The countertrend strategy involves selling during a price rise and buying when the price falls. This aligns more with the fundamental investing principle of ‘buy low, sell high.’ For short-term traders, countertrend trading is based on the concept of a reversion to the mean, which implies that after trending in one direction, the price will eventually revert to its average.
Incorporating Multiple Trendlines
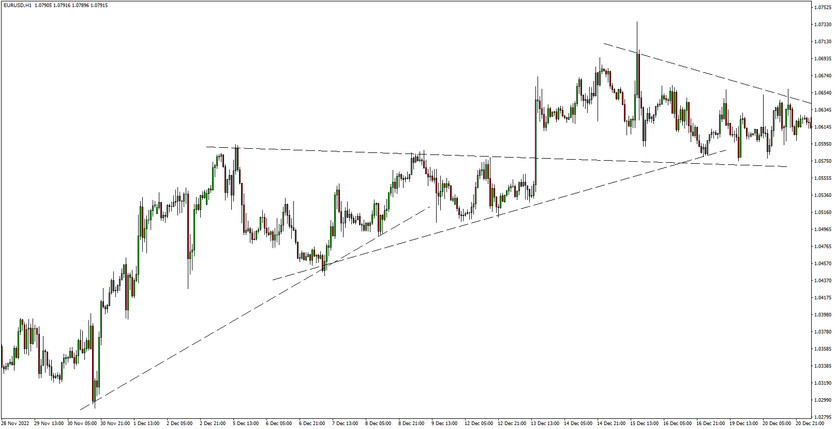
Usually, more than one trendline is active at a time. At any point, several trendlines could be drawn, each reflecting price movement over different timescales.
Trendlines with steep angles are short-lived since prices cannot maintain an almost vertical ascent or descent for long. More gradual trendlines are steadier and easier to uphold.
Sketching trendlines whenever feasible and across different timeframes can help novice traders discern the main trend, minor trends, and corrections within these minor trends.
During an uptrend, buying or going long opportunities may arise when a short-term downtrend intersects the overall uptrend line. During a downtrend, selling or shorting opportunities may arise when a short-term uptrend intersects the overall downtrend line.

Tweaking Trendlines
Once established, trendlines often need modification. Prices seldom follow a consistent pattern over a lengthy period. Thus, any speeding up or slowing down of the trend necessitates trendline adjustments.
To identify whether your trendline needs an overhaul, watch out for instances where the price breaks through your lines. If the price dips below your uptrend line, it's time for an adjustment. Similarly, during a downtrend, if the price surpasses the trendline, an adjustment is required.
However, changing a trendline doesn't equate to a change in trend. An uptrend is denoted by successive higher highs and higher lows. Until these patterns persist, it remains an uptrend. You might need to adjust your trendlines several times during a single uptrend.
Utilizing Trendlines as a Reference
Due to the frequent need for adjustments, using a trendline as an exact trade signal can be inaccurate. A minor change in the angle of a trendline can result in a significant difference in the price intersection over time.
While trendlines can act as a guide, more precise criteria are necessary to determine when to enter or exit a trade. Such criteria could include a specific size move back in the trending direction, a trigger based on an engulfing pattern, or another type of indicator that quickly and accurately adapts to volatility changes.
If you view trendlines as a guide, you won't need to stress about drawing exact highs or lows. Drafting "trendlines of best fit" can offer visual cues about potential trade zones.
Since the trendline isn't utilized as a precise trade signal, rough trendlines can provide you with relevant information about the trend without the need for continuous adjustments.
Wrapping Up
The world of trading can be perplexing and daunting, but when armed with powerful tools like trendlines, the task becomes significantly manageable. These diagonal markers can help you gauge the momentum and direction of the market, providing crucial insights that can inform your trading decisions. They are quintessential components of technical analysis that can reveal a pattern in what might otherwise appear to be random price movements.
Remember, trendlines offer an overarching guide to the behavior of the market, illuminating the prevailing trends. They highlight periods of upward momentum (uptrends), characterized by higher highs and higher lows, and periods of downward momentum (downtrends), typified by lower highs and lower lows. But don't forget, prices seldom adhere to a rigid pattern over an extended period. Therefore, adjusting your trendlines to reflect changes in market trends is often necessary.
While trendlines are indeed powerful tools, they are not infallible. They work best when used in conjunction with other technical analysis methods. Pay close attention to price action and let it inform your use of trendlines. Even when a price action contradicts your trendline (for instance, if the price sets lower lows and lower highs during an uptrend), it's essential to consider this and adjust your strategy accordingly.
Another crucial point to consider is that a trendline's precise angle can greatly impact price intersections over time, making it an unsuitable tool for exact trade signals. A minor adjustment in the angle could lead to significant changes in the forecasted price. However, by using "trendlines of best fit," you can still obtain vital information about the trend without the need for continuous readjustments.
What does a trendline indicate?
A trendline is a powerful tool that indicates the potential support and resistance levels in the market. These levels are significant as they represent points at which market sentiment has changed in the past, prompting price reactions. Although not always exact, trendlines are important reminders of these price points and, when interpreted in the context of prevailing market conditions, can be integrated with other technical analysis tools to inform your decisions about trade entries and exits.
How do you draw a trendline?
Drawing a trendline involves using your charting software's "drawing tools" section. This area houses a suite of tools including trendlines, Fibonacci retracements, and other drawing-related technical analysis tools. To draw a trendline, you select the "trendline" tool and draw a straight line connecting peaks (in a downtrend) or troughs (in an uptrend). A trendline becomes more credible as it interacts with more price points, so seek to draw lines that connect at least three price points.
In sum, trendlines can illuminate potential trading opportunities, and combined with price action signals, they provide an effective way to leverage these opportunities. Being cognizant of the above-discussed intricacies can aid you in harnessing the full potential of trendlines, thus enabling you to devise effective trading strategies.


