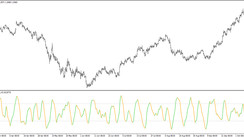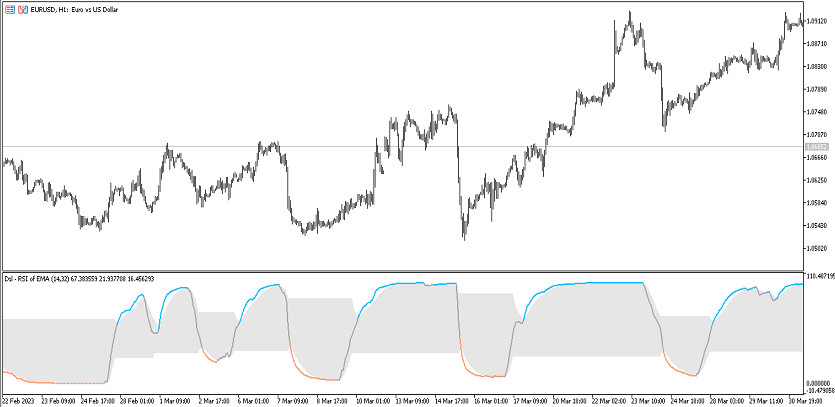
The DSL RSI of Average indicator is a small trading strategy based on the modification of the RSI indicator using a terminated signal line. The indicator's calculations, which are very accurate, are used to determine the direction and strength of the current trend, as well as to open trades in this period. The indicator is presented in the lower window of the price chart in the form of a solid line, which is painted in a certain color and moves in a certain direction relative to the DSL zone. The main values of the indicator line are used to determine the current trend and open trades in this period.
The DSL RSI of Average indicator is suitable for trading on any timeframes using any currency pairs.
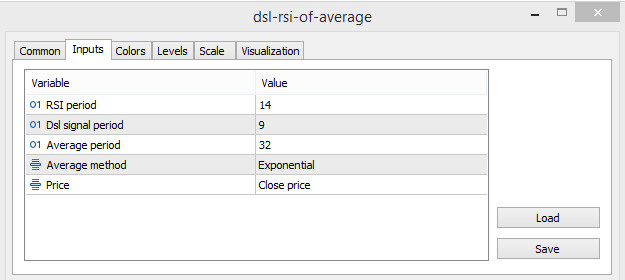
Input parameters
The input parameters of the DSL RSI of Average indicator are used to change the values of its technical work, while the Colors section in its settings is responsible for its visualization, and to add signal levels to its window, the Levels section is used.
-Rsi period - the value of the period of the RSI indicator. The default value is 14.
-Dsl signal period - DSL signal line calculation period. The default value is 9.
-Average period - smoothing period for indicator calculations. The default value is 32.
-Average method - type of smoothing of indicator calculations. By default, it has the Exponential value.
-Price - type of price at which the indicator is calculated. Close price by default.
Indicator signals
The DSL RSI of Average indicator is easy to use due to the presence of convenient visualization. To open a certain trade, one should take into account the direction of the current trend, namely the color and direction of its line, as well as its strength, that is, the location of its line relative to the DSL zone. If the current trend strong upward, long positions are opened, with a strong downward trend, short positions are opened. When the current trend changes, in both cases, trades are closed. At the moment the indicator line is in the DSL zone, trades are not opened at all.
Signal for Buy trades:
- The indicator line has a color with a growth value and goes up, crossing the DSL zone.
Upon receipt of such a condition on a signal bullish candle, a buy trade can be opened, due to the presence of an uptrend in the current market. If the trend changes or weakens, namely, when the color and direction of the line changes, the current trade should be closed and a new one should be considered.
Signal for Sell trades:
- The indicator line has a color with a fall value and is directed from top to bottom and falls below the DSL zone.
A sell trade can be opened on a signal candle immediately upon receipt of such conditions. At this moment, a strong downtrend is determined in the market. The trade should be closed and the opening of new trades should be considered when the trend changes or weakens, namely, when the color and direction of the line changes.
Conclusion
The DSL RSI of Average indicator is a very effective indicator, since its calculations are based on the interaction of precise trading algorithms. Although the indicator is easy to use, it is recommended to use a demo account before using it on a real deposit.