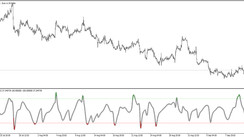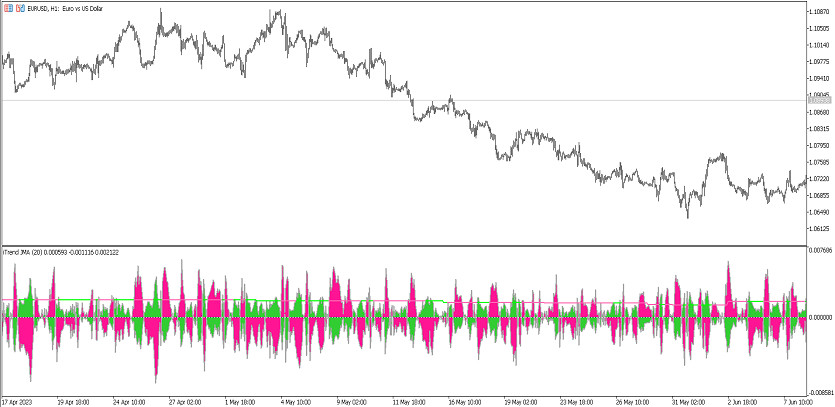
The iTrend JMA indicator is a trading algorithm based on the interaction of several Forex indicators that create an effective trading strategy. Its calculations are aimed at determining the direction and strength of the current trend, as well as opening trades in this period. The indicator is presented in the lower window of the price chart as a colored histogram with a signal and main line, as well as a signal level. The current values of the indicator, namely all its values, are used to determine the direction of the market movement, taking into account which trades can be opened.
The iTrend JMA indicator is suitable for trading on any timeframe using any currency pairs.
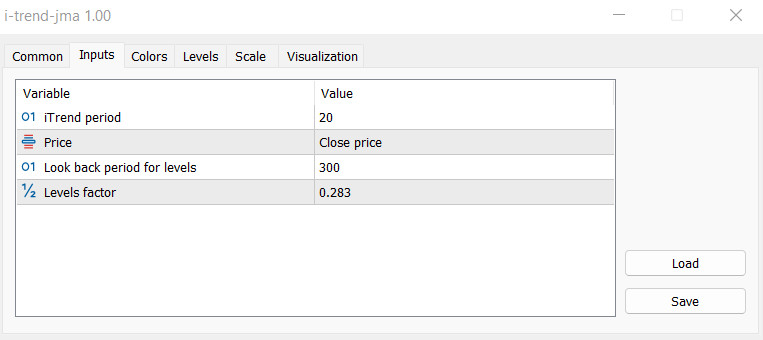
Input parameters
There are several sections in the iTrend JMA indicator settings that are responsible for its general functioning. The Input parameters section is responsible for its technical work, the Colors section is used to change its visualization, including its color scheme and value thickness, to add signal levels to the indicator window, use the Levels section.
-iTrend period - indicator calculation period. The default value is 20.
-Price - type of the price to which the indicator calculations are applied. By default, it has the Close price value.
-Look back period for levels - the period for calculating levels based on previous values. The default value is 300.
-Levels factor - indicator levels factor value. The default value is 0.283.
Indicator signals
The iTrend JMA indicator is very easy to use, thanks to a convenient and understandable visualization. To open a trade, the current trend is determined first. To do this, take into account such indicator values as the location of the histogram and its signal relative to the signal level, its color and direction, as well as the color its main line. If the indicator values determine an uptrend, long positions are opened, if the trend is down, short positions are opened. At the moment when the indicator histogram has a neutral color and is in the non-trading zone, trades should not be opened. When the current trend changes, in both cases, trades are closed.
Signal for Buy trades:
- The histogram of the indicator has a color with a growth value and is located above level 0. The main line also has a color with a growth value.
Upon receipt of such conditions, a buy trade can be opened on the signal candle due to the presence of an uptrend in the current market. It should be closed at the moment of a change or weakening of the trend, namely, when the color and direction of the indicator histogram change. At this moment, one should consider opening new trades.
Signal for Sell trades:
- The main line has a color with a fall value. The indicator histogram with its line is directed downward relative to the signal level and has a color with a fall value.
A sell trade, due to the presence of a downtrend, can be opened immediately upon receipt of such conditions on the signal candle. At the time of the trend weakening and its change, that is, upon receiving the opposite conditions from the indicator, the current trade should be closed and a new one should be considered.
Conclusion
The iTrend JMA indicator is a very effective trading algorithm, the calculations of which are based on the interaction of calculations of exact forex indicators. Before using the indicator on a real deposit, preliminary practice on a demo account is recommended. And to improve the accuracy of its signals, it is recommended to use it with additional indicators, filters and advisers.