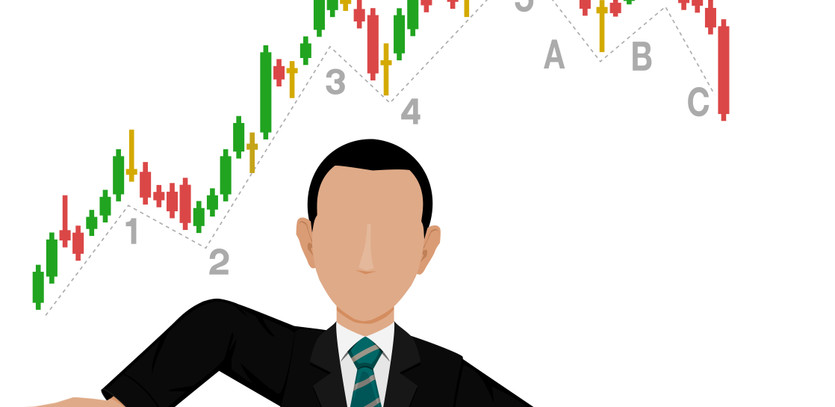
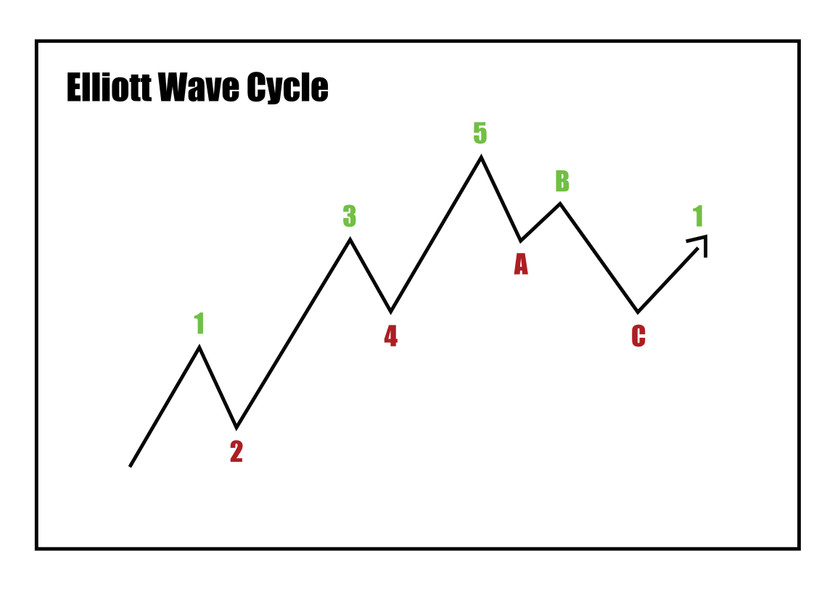
In 1938, the renowned accountant Ralph Nelson Elliott introduced the world to his novel market analysis concept, The Wave Principle. This theory, premised on pattern recognition, suggested that market trends are defined by a sequence of five waves moving in the same direction as the primary impulse, while three waves oppose it. According to the theory, each wave subdivides into three smaller waves following the trend, and two waves against it, ultimately painting a picture of a fractal market where similar patterns are seen across varying time frames.
Understanding the Elliott Wave Theory
The Elliott Wave Theory (EWT) holds an intriguing spot in market analysis folklore. Some practitioners spend several years mastering its nuances, while skeptics dismiss it as mere hocus-pocus, preferring traditional price prediction methods. Despite Wall Street's overt criticism, whispers persist about major market players secretly consulting wave theory experts to inform crucial market decisions.
Practical Application of Elliott Wave Theory
The good news is that you don't have to be part of a clandestine group or memorize countless rules to leverage the power of EWT. Three simple wave principles can be incorporated into a popular breakout strategy to enhance market timing and profit generation. These principles become applicable after a significant low occurs and a financial instrument is on the verge of a key breakout level.
Let's examine the case of Aetna (AET), which peaked near 86 in July 2014 after an extended rally, then adjusted in a standard ABC pattern concluding at 72 in October. By early November, the stock had rebounded to resistance levels equivalent to the summer's high, forming two rally waves and pausing until mid-month. An analysis of the buying surge into resistance using three EWT principles helped forecast the subsequent events, as it hinted at an emerging Elliott 5-wave rally set.
To validate this hypothesis, let's apply the first two principles:
Principle A: The Limitations of Wave Fluctuations
According to the first principle, the 4th wave's bottom (second selloff) shouldn't surpass the peak of the 1st wave. In this case, the initial wave culminated at 79.64 on October 27. After a brief dip to 76, the stock shot back up, reaching resistance slightly over 85. Here, it paused, forming a prospective 4th wave that found support near 82. The ample room between the highest and lowest points of the 1st and 4th waves, respectively, increases the likelihood of a 4th wave consolidation, leading to a 5th wave breakout and an uptrend.
Principle B: Understanding Continuation Gaps
The second principle revolves around the idea that a continuation gap often corresponds precisely with the midpoint of the 3rd wave (second rally). A continuation gap, as detailed by Edwards and Magee in their seminal 1948 book, Technical Analysis of Stock Trends, occurs when the price leaps up significantly, continuing to rise, effectively doubling the previous wave's length. In Aetna's case, a continuation gap appeared on October 31 (marked by a red circle), signifying the halfway mark of the 3rd wave. This insight strengthens our trade analysis, suggesting a likely breakout and potential price increase.
With these principles in play, we can buy into the 4th wave, forecasting the breakout. A stop can also be placed beneath the trading range to limit potential losses if our prediction proves inaccurate. This leads us to the final principle.
Principle C: Predicting Price Gain
The third principle asserts that two of the three primary waves will likely have the same price gain. Given that we've identified and entered a 4th wave trade setup, which is expected to yield an uptrend similar in length to the first or third wave, we can make some predictions. The first wave saw an increase of 7.84 points, while the third wave added 8.81 points. By averaging these figures, we add 8.30 points to the bottom of the 4th wave at 81.93, providing us a minimum reward target slightly above 90.
The Power of Elliott Wave Theory
By mid-November, Aetna had embarked on a 5th wave rally, reaching a swing high of 91.25, exceeding our Elliott target. At this juncture, sound risk management is critical. It's important to note that reaching the hypothetical end point doesn't necessitate a sell-off. Often, Elliott wave rallies keep multiplying, particularly during the 5th waves, as buying signals trigger and momentum traders invest heavily.
The Fibonacci Connection with Elliott Waves
Elliott astutely noted that the Fibonacci sequence corresponds to the count of waves in impulses and corrective phases. It's not unusual to observe Fibonacci ratios like 38% and 62% depicting relationships between waves in terms of price and time. To illustrate, a wave moving in a corrective direction could potentially retrace 38% of the preceding impulse wave.
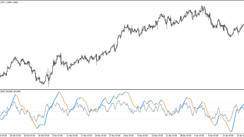
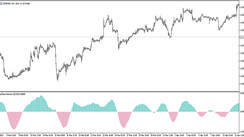
Inspired Indicators: Beyond the Elliott Wave Theory
Several analysts, drawing inspiration from the Elliott Wave principle, have devised unique indicators. One such tool is the Elliott Wave Oscillator Chart. This oscillator delivers a digitally computed prediction of future price movements, relying on the differential between a five-period and a 34-period moving average.
Moreover, Elliott Wave International has pioneered an artificial intelligence system named EWAVES. This system applies all the rules and guidelines of the Elliott wave principle to data, culminating in an automated Elliott wave analysis.