Introduction: The Significance of Support and Resistance in Market Analysis
Understanding the nuances of the financial market is a lot like solving a jigsaw puzzle – each piece, however small, plays a pivotal role in completing the picture. Two such essential pieces of the trading puzzle are the concepts of 'support' and 'resistance'. These are crucial tools for those engaged in technical analysis, providing valuable insight into potential turning points in market trends.
In a nutshell, support and resistance are indicative of concentration points of demand and supply in the market.
-
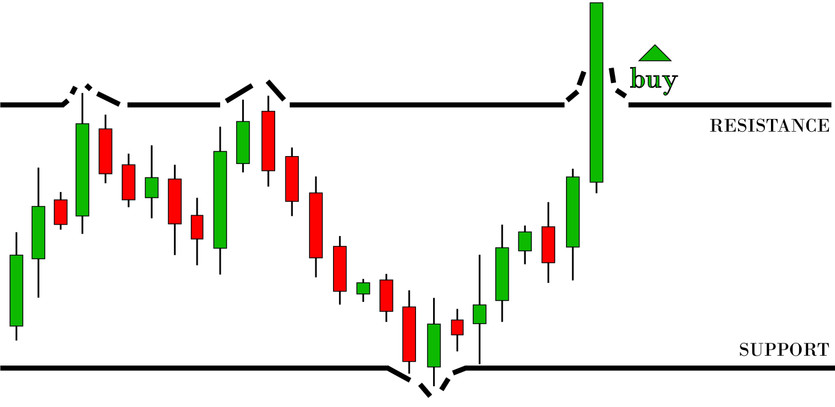
Support is a price level where a downtrend could potentially pause due to a significant concentration of demand or interest. It's akin to a safety net, preventing the price from falling further.
-
Resistance, conversely, represents a price level where an uptrend might stall temporarily owing to a significant accumulation of supply or selling interest. It acts as a ceiling, restricting the price from soaring higher.
These levels are far from random, and their formation is often deeply rooted in market sentiment and the psychological biases of market participants.
Understanding Trading Level Key Concepts
Trading levels, particularly support and resistance, function as barriers in asset pricing. They resist the push of asset price in a specific direction and serve as strategic indicators for traders and investors.
- Market psychology shapes these crucial levels, as participants remember past market performance and react to changing market conditions to predict future movement.
- Understanding the sentiment and emotional reactions of individual market players can shed light on shifting zones of resistance and support.
The combined decision-making processes of market participants result in the emergence of these price levels. This collective behavior can influence the price trajectory in interesting ways. For instance, a strong support level can elicit a bounce-back of price due to heavy buying interest, while a strong resistance level can halt a rising price due to heavy selling pressure.
Let's delve deeper into these concepts and see how the psychology behind support and resistance levels plays out in a market setting.
Market Psychology and Its Influence on Support and Resistance
In the world of financial markets, the understanding of support and resistance levels revolves around human psychology. The decisions made by market participants are influenced by their emotions and mindset, making psychology a fundamental aspect of market movements. A deeper understanding of market psychology can offer valuable insights into the dynamic interplay of support and resistance.
Different Types of Market Participants
Typically, three types of participants are involved at any given price level in a financial market:
- Bullish Investors: These are investors who have gone long and are eagerly waiting for the price to rise.
- Bearish Investors: These are investors who have shorted the asset and are hoping for the price to fall.
- Undecided Investors: These are the market participants who are yet to make up their minds about which way to trade and hence, they remain on the sidelines.
Each of these investor types has a distinct psychological reaction when the price moves, especially around support and resistance levels.
The Psychological Response of Different Investors
As the price begins its ascent from a support level, a variety of reactions unfold among these three types of traders:
-
Bullish Investors are elated as their anticipation of a price increase comes to fruition. If the price retreats to the same support level, these investors might consider augmenting their positions, confident in the strength of the support level. Their eagerness to capitalize on the opportunity further bolsters the support level.
-
Bearish Investors begin to feel a sense of unease as the price increases. They may contemplate exiting their positions, a strategy known as 'buying to cover', to break even if the price reaches the support level again. Their actions might inadvertently strengthen the support level as their buying pressure adds to the demand.
-
Undecided Investors become alert, watching the price fluctuations closely. If the price revisits the support level, they might decide to enter the market, going long. Their entrance creates additional demand, solidifying the support level.
In essence, this gathering of different market participants around a support level strengthens its role as a significant price point. Their collective optimism and buying pressure can often cause the price to rebound from the support level.
Conversely, if the price falls through the support level, the psychology of the market participants takes a drastic turn. The long traders may now hold out for the price to climb back to the erstwhile support level, which now acts as resistance, to cut their losses. The bearish investors are now jubilant and might consider adding to their short positions if the price revisits the price level. Meanwhile, the undecided investors may now enter the market, going short in anticipation of further price drops.
The reverse of these reactions occurs when the market approaches a resistance level, displaying the symmetry of market psychology at support and resistance levels.
The Collective Impact on the Market
The collective action of these participants at these key levels strengthens the area's role as a support or resistance. This psychological phenomenon, which significantly impacts the dynamics of supply and demand, often leads to the strengthening of support and resistance zones, thereby setting the stage for future price actions.
Understanding this intricate interplay of market psychology and price action provides traders and investors with valuable insights that can help them make better-informed decisions.
Remember: Understanding the collective psychology of market participants is crucial. It's the collective sentiment that often drives the markets, shaping the support and resistance levels that so many traders rely on for their technical analysis.
Shifting Zones: A Real-World Example
The ever-evolving nature of financial markets is visible in the dynamic shifts of support and resistance zones. Their transitory nature reflects the changing sentiment of market participants. To illustrate this concept, let's delve into a real-world example that highlights how these levels morph over time.
The Basic Principle
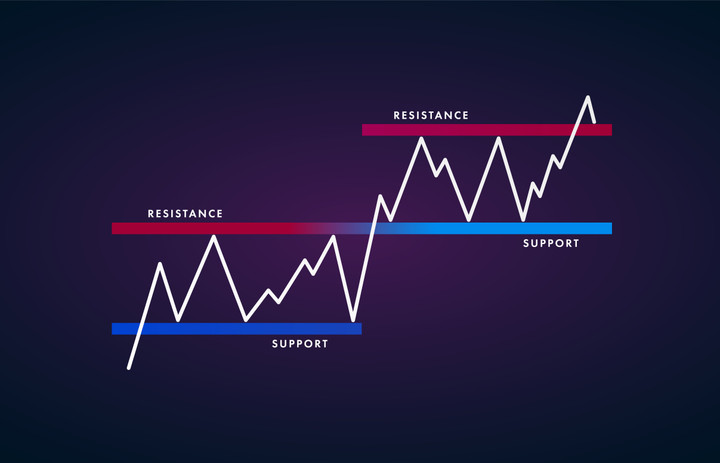
One of the foundational principles of technical analysis is the tendency for support and resistance zones to interchange roles. A level that once served as support can become resistance, and vice versa, as market conditions change. This transformation is observable across various chart types and time frames.
For day traders who operate on shorter timeframes, this shift is readily identifiable. Simultaneously, long-term investors, who refer to daily or weekly charts, can also observe these transformations, attesting to the universal applicability of this principle.
A Practical Illustration
To bring this principle to life, let's look at the weekly price chart of a hypothetical company, "Montreal Trucking Company". The chart reveals a critical resistance level at $15, which consistently prevents the price from climbing higher. Simultaneously, a support level emerges at $7, where the price seems to find a solid ground before rebounding.
Interestingly, these zones aren't just confined to these specific price levels. As the market ebbs and flows, so too do these zones. They adapt to the shifting sentiments, mirroring the dynamic interplay of supply and demand. Thus, upward or downward trendlines can also indicate evolving support and resistance zones.
The Bottom Line
This practical illustration of the Montreal Trucking Company's price chart encapsulates the dynamic shifts of support and resistance zones. Understanding the fluidity of these zones is essential for every market participant. By recognizing this continuous transformation, traders and investors can better anticipate potential price reversals or continuations, thereby enhancing their trading strategy.
Key takeaway: Markets are dynamic, and so are support and resistance zones. Being aware of these shifts and understanding their implications is a crucial part of successful technical analysis.
Human Emotions and Market Behavior
The impact of human psychology on financial markets is vast and complex. Emotions play a pivotal role in driving trading behavior and influencing price action. This section delves into the psychology behind the formation of support and resistance levels.
The Role of Fear and Greed
At the core of any market movement, two primal emotions often reign: fear and greed. These emotional states, though they seem basic, can significantly shape market behaviors.
When a price returns to a support level, traders who are already in a long position are likely to add to their positions to reap larger profits, driven by greed. Simultaneously, traders in a short position may buy to cover, driven by fear of losing money if the price rebounds off the support level.
The Herd Instinct
Yet another critical psychological factor at play in the financial markets is the herd instinct. Traders often congregate around these critical support and resistance levels, as they tend to move in the same direction as the majority. This mass convergence at these levels reinforces their strength and influence on price movements.
Anchoring: A Conditioned Response
Beyond fear, greed, and the herd instinct, traders may also experience what is known as a "conditioned response." This reaction is primarily due to anchoring, a cognitive bias described by behavioral finance.
Anchoring refers to the use of irrelevant information, such as the initial purchase price of an asset, as a fixed reference point for making subsequent decisions. It is a subconscious psychological process that assigns significance to this arbitrary value. If a resistance or support level has been established in the past, this price point can create a shared anchor. Future interactions with these same levels may then provoke similar reactions among market participants, reinforcing the level's significance.
The Power of Emotional Price Levels
Certain price levels carry strong emotional resonance for market participants. These can include round numbers, 52-week highs and lows, or even historic events such as new market highs.
- Round Numbers: They are significant because they're easy to remember and mentally convenient.
- 52-Week Highs and Lows: These levels are watched closely by the trading community and can often turn into self-fulfilling prophecies.
- Historic Events: These points can serve as emotional reminders of dramatic gains or losses, influencing future trading decisions.
These price levels attract attention, create anticipation, and can lead to increased trading volume as more traders prepare to respond. Traders and investors tend to gravitate towards these levels for several reasons. One is that these price levels have been significant in the past, creating an expectation that they will be significant again in the future.
Key Takeaway: Human emotions and behaviors play a significant role in shaping market trends. By understanding these psychological aspects, traders can gain a more nuanced understanding of why support and resistance levels form and how they can impact future price movements.
Emotional Price Levels and Their Impact
Price levels that evoke strong emotions among traders and investors tend to have a significant influence on market activity. These emotional price levels can act as powerful support or resistance zones, serving as psychological barriers or targets that can guide market participants' actions. This section explores in more detail the nature of these emotional price levels and why they are so impactful.
Round Numbers: A Psychological Magnet
One form of emotional price level is round numbers. Market participants are often drawn to round numbers as they are easy to remember and mentally appealing. This gravitation can make these price levels significant points of support or resistance.
Consider the psychological difference between an asset priced at $99.50 versus one at $100. The latter, being a round number, may serve as a stronger resistance level because it's easier to remember and carries a psychological weight. It creates a mental milestone that traders and investors might use to anchor their expectations or decisions.
52-Week Highs and Lows: Reflecting Market Sentiment
Another kind of emotional price level relates to 52-week highs and lows. These levels serve as markers of an asset's performance over the past year and often reflect overall market sentiment.
A 52-week high can generate excitement and optimism among market participants, potentially sparking further buying activity that pushes prices even higher. Conversely, a 52-week low might be associated with negative sentiment, potentially triggering selling pressure that drives prices even lower.
Historic Events: Echoes of the Past
Significant historical price levels, such as those related to key market events or milestones, can also act as emotional price levels. These levels serve as reminders of past market conditions, influencing traders' expectations and reactions to current market conditions.
For instance, if an asset's price previously crashed after reaching a certain level, that level might become a strong resistance point in the future. Traders could remember the past downturn and become cautious as the price approaches the same level again.
Emotional Price Levels: Fueling Market Activity
The power of emotional price levels lies in their ability to attract attention, increase anticipation, and stimulate trading activity. These levels can create a buzz of excitement or fear among traders, leading to increased trading volumes as more traders prepare to respond to potential price movements.
Consider a situation where a market reaches new highs. The euphoria that such an event generates can lead to a significant price surge, typically accompanied by increased trading activity, until enthusiasm wanes and a new resistance level is established.
Key Takeaway: Emotional price levels act as significant markers in the trading landscape. They can serve as strong support or resistance zones, influencing the decisions of traders and investors. Understanding these emotional price levels can help traders anticipate potential price movements and plan their trading strategies more effectively.
Conclusion: Unraveling the Complexities of Support and Resistance
In closing our exploration of support and resistance levels in trading, we delve into some of the frequently asked questions on the subject and consolidate our understanding. From understanding the basics of these levels to appreciating the psychological factors involved, let's wrap up our comprehensive look at these essential trading concepts.
Understanding the Basics: Support and Resistance Levels
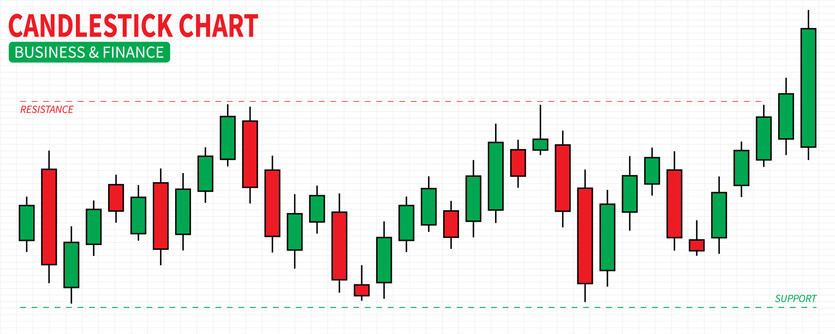
In financial markets, support and resistance levels are considered the floor and ceiling for asset prices. These levels come into play when prices test their lower (support) or upper (resistance) bounds.
- A support level behaves like a floor, halting a price drop and potentially triggering a bounce back.
- A resistance level, on the other hand, acts as a ceiling, preventing prices from moving higher.
If a support level is breached, it's typically an indication for the price to fall to the next support level. These levels stem from market psychology, with bullish sentiment taking shape at support levels and bearish sentiment at resistance levels.
The Importance for Technical Traders
Support and resistance levels are instrumental for technical traders. These traders leverage these levels to plan their trading entries and exits.
- When prices break through support levels, traders consider it as a cue to either buy in or take a short position, based on their interpretation of other market indicators.
- If such a breach occurs during an uptrend, it might even hint at a potential market reversal, a valuable piece of information for traders to plan their next move.
Anchoring: A Key Psychological Factor
Anchoring is a psychological phenomenon where traders assign significance to an arbitrary value, using it as a reference point for future trading decisions. A previously established level of support or resistance may become an 'anchor', around which future trading activity and market expectations revolve.
- For instance, round numbers such as $1,000 or $25,000, although devoid of any fundamental influence, may serve as crucial support or resistance levels simply due to their psychological appeal.
- As these levels are breached, traders adjust their anchors accordingly, perpetuating the influence of these psychological markers on market activity.
Final Thoughts
The dynamic world of financial trading revolves around support and resistance zones. Analysts use them to analyze past price activity and forecast future market movements. These zones can be visualized using straightforward tools like horizontal lines or trendlines, or with advanced indicators such as Fibonacci retracements.
Market psychology forms the backbone of these price movements, as traders and investors react based on their memories of past market behavior, current market conditions, and anticipations of future market trends. In the final analysis, understanding market psychology provides the key to predicting future market behavior.
Key Takeaway: Support and resistance levels are central to technical analysis, helping traders predict potential price movements. They are shaped significantly by market psychology, underlining the importance of understanding how traders and investors react to market conditions. The skill to decode the emotions and expectations reflected in these levels can be a powerful tool in a trader's arsenal.