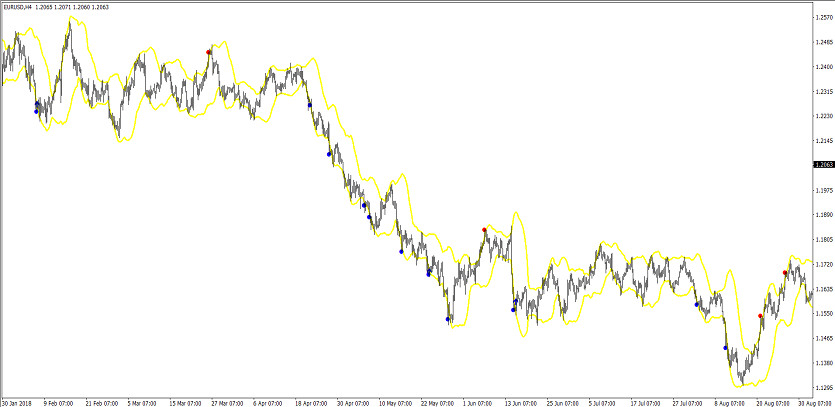
The RSI vs Bollinger Bands indicator is a trading algorithm used to trade during a certain market trend. Its calculations consist of the interaction of standard forex indicators. They are aimed at determining the direction of the current trend and opening a trade during this period. The indicator is presented directly in the main window a price chart in the form of a channel consisting of lower and upper boundaries and dots and arrows, which, depending on the current market conditions, are painted in a certain color and are located along the upper or lower boundary of the channel. Taking into account the current values of the indicator, a certain trade can be opened.
The indicator is suitable for use on any timeframe, with any currency pairs.
Input parameters
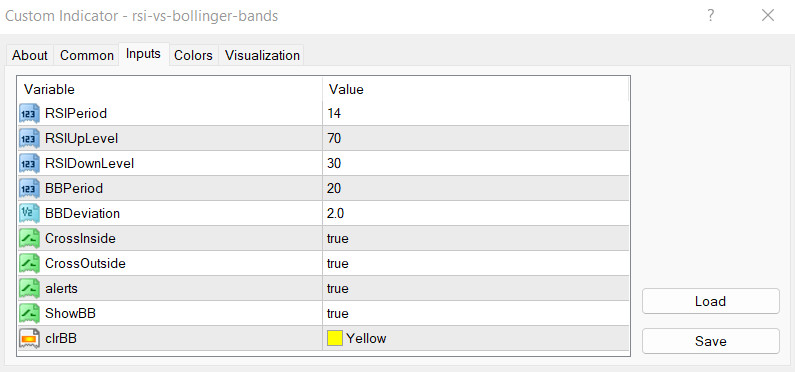
RSI vs Bollinger Bands indicator settings consist of several sections. The Input Parameters section is quite advanced and is responsible for its technical operation. The Colors section is used to change its visualization values.
-RSIPeriod - calculation period of the RSI indicator. The default value is 14.
-RSIUpLevel - value of the upper signal level of the RSI indicator. The default value is 70.
-RSIDownLevel - RSI low level period. Default value is 30.
-BBPeriod - parameter of the period of the Bollinger Bands indicator. The default value is 20.
-BBDeviation - current deviation of the indicator values from the standard. The default value is 2.0.
-CrossInside - parameter for arrows to appear when crossing a line from the inside. The default value is true.
-CrossOutside - the parameter for the formation of arrows during the period of the outer intersection of the line. The default value is true.
-alerts - Alert presence parameter. The default value is true.
-ShowBB - parameter of the presence of the Bollinger Bands channel on the chart. The default value is true.
-clrBB - the color of the channel of the indicator lines. The default value is Yellow.
Indicator signals
The algorithm for using the RSI vs Bollinger Bands indicator is very simple. To open a certain trade one should take into account the current trend, which is determined by the direction of the indicator channel, as well as the formation of dots and arrows that cross one of its borders. If the current trend is upward, long positions are opened if downward trend-short positions. During the trend change, in both cases, trades are closed.
Signal for Buy trades:
- The indicator channel is directed upwards. An upward arrow is formed on the upper border.
Upon receipt of such conditions characterizing an uptrend, a buy trade can be opened. Close the trade and consider opening a new one when a point appears on the chart, colored with a growth value. At this moment, a change in the current trend is possible.
Signal for Sell trades:
- The indicator lines move from top to bottom. An arrow is formed on the bottom line of the indicator, pointing down.
A sell trade caused by a downtrend can be opened immediately upon receipt of such conditions on a signal candle. At the moment a point with a falling value is formed, the trade should be closed. During this period, a change in the current trend is possible, which will allow considering opening a new trade.
Conclusion
The RSI vs Bollinger Bands indicator is a very powerful trading algorithm, the calculations of which are extremely accurate thanks to indicators whose effectiveness has been proven over time. Despite the ease of use, it is recommended to use the indicator on a demo account before trading on a real deposit.