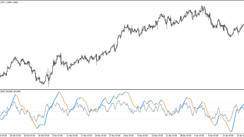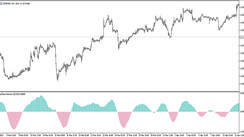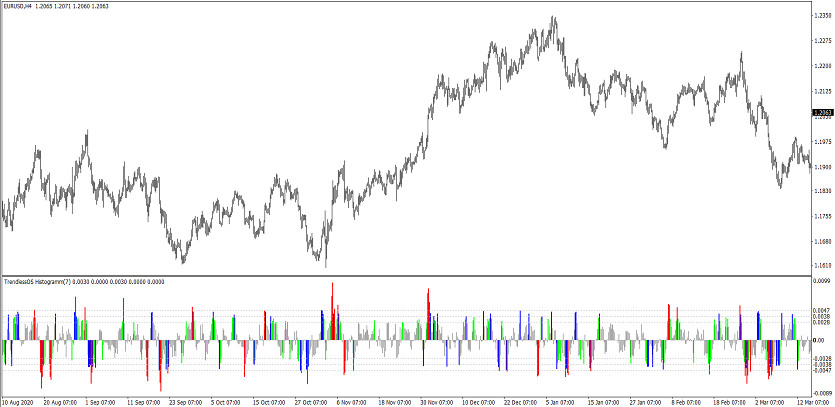
The Trendless OS Histogram indicator is an unusual trading algorithm, which is based on the use of a standard Forex indicator. Its main difference is that the indicator is based on the use of off-trend trading. Instead of opening a specific trade, the indicator uses the moment the market is in the zone of overbought or oversold. The indicator is presented in the lower window of the price chart in the form of a histogram that changes its color, direction and location relative to its signal levels. Taking into account these indicator values, current information about the market is taken into account, which in turn is taken into account when opening trades.
The Trendless OS Histogram indicator is suitable for use on any timeframe, with any currency pairs.
Input parameters
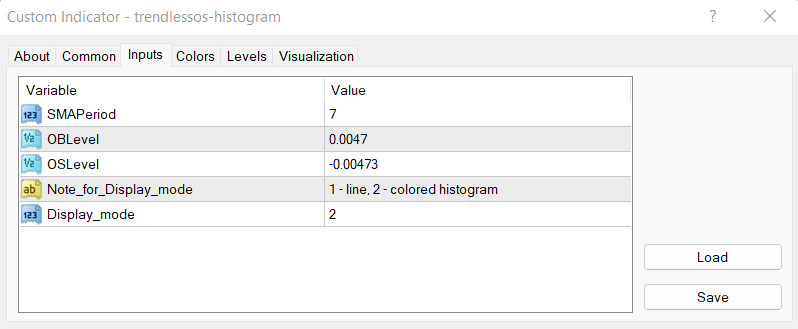
In the settings of the Trendless OS Histogram indicator there are several sections responsible for its general functioning. The Input Parameters section is responsible for its technical operation, the Colors section is responsible for its general visualization, and the Levels section is used to add signal levels to the indicator window.
-SMAPeriod - period of the SMA moving average. Default value is 7.
-OBLevel - overbought signal level of the indicator. The default value is 0.0047.
-OSLevel - period of the indicator’s oversold signal level. The default value is -0.0047.
-Note for Display mode - parameter for indicator number values. By default, it has the value 1-line,2-colored histogram.
-Display mode - parameter for displaying indicator values in the price chart window. The default value is 2.
Indicator signals
The Trendless OS Histogram indicator is very easy to use since the algorithm for its use is similar to the use of other similar histogram indicators. To open a specific trade, it should be taken into account the color and direction of the histogram columns, as well as their location relative to signal levels. If the market is determined to be in a zone overbought, long positions are opened, if the market is in the oversold zone, short positions are opened. When the market zone changes, in both cases, trades are closed. It should be borne in mind that trades should not be opened at a time when the histogram columns have a neutral shade, regardless of their location.
Signal for Buy trades:
- Several bars of the histogram are colored with the value of growth and are heading upward towards the overbought level.
When such conditions are received on the signal candle, a buy trade can be opened due to the market being in the overbought zone. When the market location changes, namely when leaving the overbought zone, the trade should be closed and a new one should be considered.
Signal for Sell trades:
- At least one histogram column is located below level 0, crossing the oversold level and has a color with a fall value.
A sell trade can be opened immediately upon receipt of such conditions on the signal candle. At this moment, the market is in the oversold zone. At the moment the market zone changes, the current trade should be closed and new ones should be considered.
Conclusion
The Trendless OS Histogram indicator is a very unusual, and despite this, a very effective trading algorithm. Although the indicator is easy to use, practice on a demo account is recommended before using it on a real deposit.