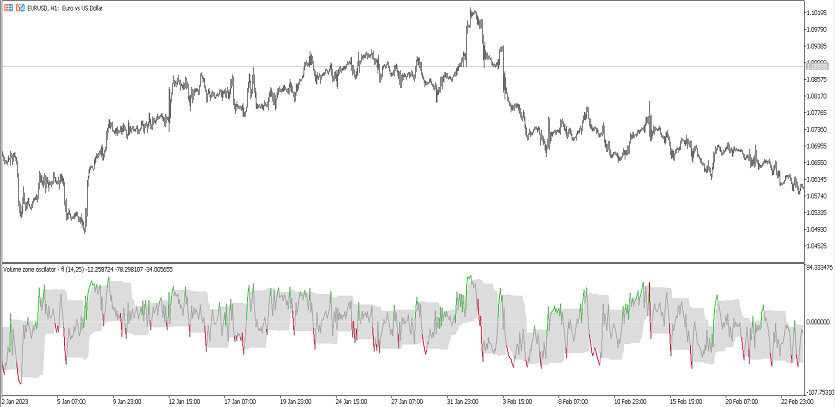
The Volume Zone Oscillator indicator is a trading algorithm that uses information about the volumes of the current market to trade. That is, the indicator's calculations are aimed at determining the volume of Buys and Sells in the current market. The indicator is presented in the lower window of the price chart as a solid line, which when under certain market conditions, it is painted in a certain color and moves in a certain direction relative to the neutral zone. Taking into account the current values, the indicator determines the volume, which in turn allows determining the moment of opening a trade.
The Volume Zone Oscillator indicator is suitable for trading on any timeframes using any trading assets.
Input parameters
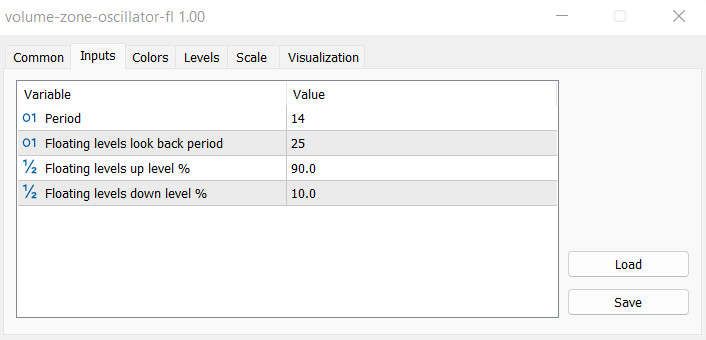
There are several sections in the settings of the Volume Zone Oscillator indicator aimed at its general functioning. The Input Parameters section is responsible for its technical work, the Colors section is responsible for the general visualization, and the Levels section is responsible for adding signal levels to the indicator window.
-Period - indicator calculation period. The default value is 14.
-Floating levels look back period - parameter of the period for calculating levels based on previous values. The default value is 25.
-Floating levels up level % - period of the upper level of the indicator in percent. The default value is 90.0.
-Floating levels down level % - period of the indicator's low level. The default value is 10.0.

Indicator signals
The Volume Zone Oscillator indicator is very easy to use due to its visualization. To open a certain trade, it should be taken into account the volume of the current market. For this, the direction, color and location of the line in the neutral zone are taken into account. If the Buy volume is high, a buy trade can be opened, if the Sell volume is high, a sell trade. When the volume decreases or changes in dominance, in both cases trades are closed.
Signal for Buy trades:
- The indicator line moves up and leaves the neutral zone, turning into the color with the growth value.
Upon receipt of such conditions, due to an increase in the Buy volume, a buy trade may be opened. At the time of a decrease in volume, that is, when the direction and color of the line changes, the current trade should be closed and a new one should be considered to be opened.
Signal for Sell trades:
- The indicator line crosses the neutral zone down and is colored with the falling value.
A sell trade can be opened immediately upon receipt of such conditions. At this moment, the Sell volume in the market increases. If the direction and color of the line change, the trade should be closed. At this moment, the market volume changes, which in turn allows considering opening new trades.
Conclusion
The Volume Zone Oscillator indicator is a very accurate trading algorithm based on a volume trading system, the effectiveness of which has been proven over time. Although the indicator is easy to use, it is recommended to use a demo account before trading on a real deposit.


