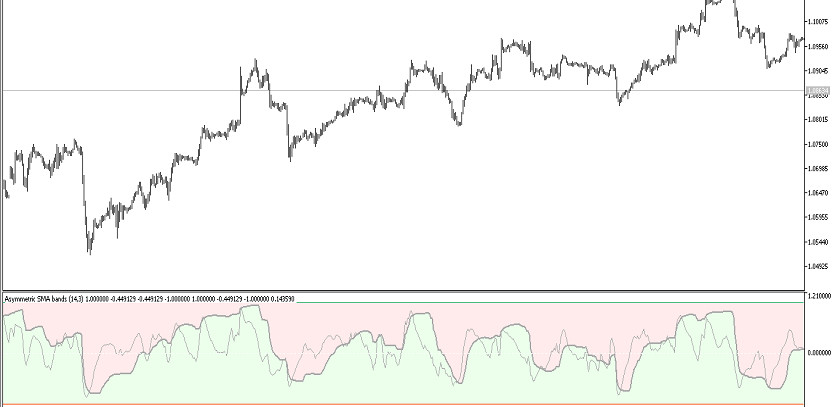
Asymmetric Bands Oscillator Extended is an algorithm based on the calculations of the Bollinger Bands indicator, which is included in the standard forex set. Its calculations are used to identify the direction and strength of the current trend, as well as to open certain trades taking into account this information during this period. Asymmetric Bands indicator Oscillator Extended is represented in the lower window of the price chart as two intersecting lines: signal and main, which in turn move in a certain direction and is located above or below the signal level. When a certain market movement occurs, the indicator lines are located in the zone of a bullish or bearish trend. Data indicator values, in turn, determine the current trend, taking into account which trades can be opened.
The Asymmetric Bands Oscillator Extended indicator works equally effectively on all timeframes, with any currency pairs.
Input parameters
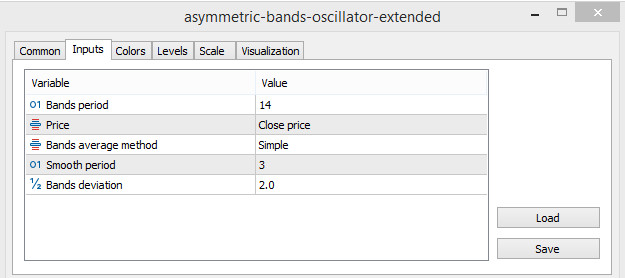
The input parameters of the Asymmetric Bands Oscillator Extended indicator are used for its general functioning, namely, changing its values taking into account the selected currency pair or time interval. To change its general visualization, including the color scheme, the Colors section is used, and in order to add signal levels, the Levels section is used.
-Bands period - value of the indicator period. The default value is 14
-Price - type of the price at which the indicator values are calculated. The default value is Close price.
-Bands average method - method for smoothing the lines used by the indicator. The default value is Simple.
-Smooth period - period for smoothing the indicator values. The default value is 3.
-Bands deviation - the current deviation of the indicator values from the standard. The default value is 2.0.

Indicator signals
The algorithm for using the Asymmetric Bands Oscillator Extended indicator is very simple due to the presence of a clear and convenient visualization. To open a certain trade, it should be taken into account the current values of the indicator, which in turn determine the current trend and its strength in the market. If the indicator determines a strong upward trend, long positions are opened, with a strong downward trend, short positions. And when the trend changes, in both cases, trades are closed.
Signal for Buy trades:
- The indicator lines are located in the bullish trend zone and move above the 0 level. At the same time, its main line is above the signal line.
When a full combination of such conditions is received on a signal candle, a buy trade can be opened, due to the presence of a strong uptrend in the current market. Such trade should be closed when the current trend changes, namely at the moment of the reverse intersection of the indicator lines. At this moment, it should be considered opening new positions.
Signal for Sell trades:
- The indicator lines intersect so that the signal line is higher than the main one. Both lines are below the 0 level in the bearish zone.
A sell trade can be opened immediately upon receipt of such conditions on a signal candle. At this moment, a strong downtrend is determined in the market. Upon receipt of reverse conditions from the indicator, the trade should be closed. At this moment the opening of new trades can be considered.
Conclusion
The Asymmetric Bands Oscillator Extended indicator is an interesting trading algorithm that does not use standard calculations, which in turn makes trading easier and more profitable. Despite its simple visualization, prior practice on a demo account is recommended before trading on a real deposit.


